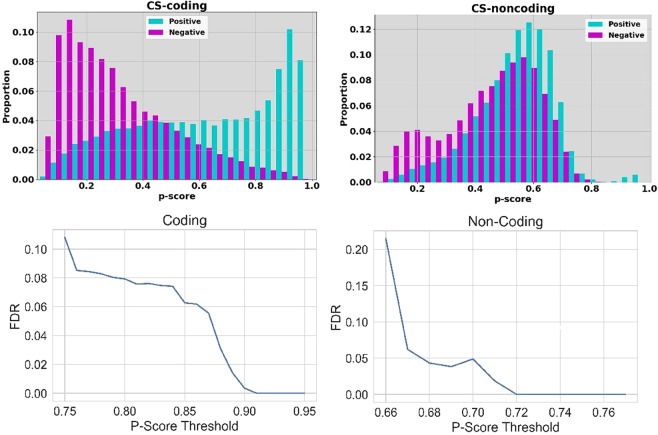
Figure 1.
Top, left: the proportions (y-axis) for prediction of positives (disease-drivers) and negatives (neutral) at different values of the p-score threshold (x-axis), for predictions in coding regions of the cancer genome. Top, right: the proportions (y-axis) for prediction of positives (disease-drivers) and negatives (neutral) at different values for the p-score threshold (x-axis), for predictions in non-coding regions of the cancer genome. Bottom, left: The False Discovery rate (FDR, y-axis) versus the threshold on the p-score (x-axis) for prediction in coding regions. Bottom, right: The False Discovery rate (FDR, y-axis) versus the threshold on the p-score (x-axis) for prediction in non-coding regions.

