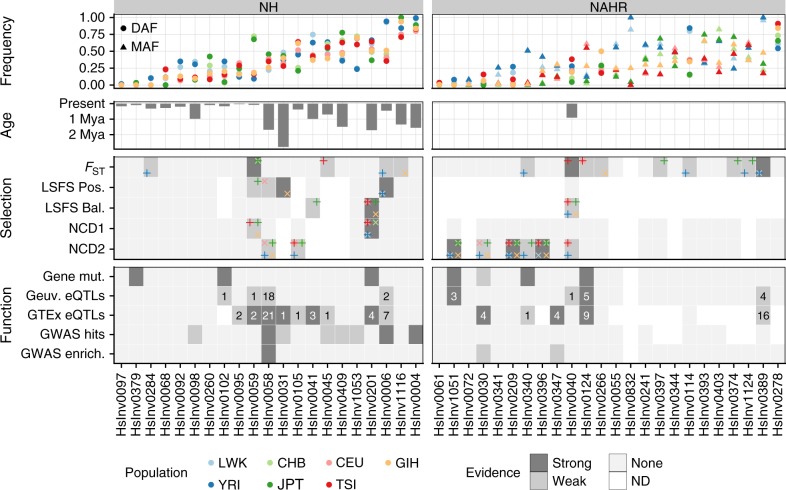
Fig. 2.
Evolutionary and functional information for human polymorphic inversions. Frequency: inversion frequencies in the 480 unrelated individuals from seven populations, showing either the derived allele frequency (DAF) if the ancestral orientation is known or the minor allele frequency (MAF) according to the global frequency of the inversion otherwise (which enables the MAF to be higher than 0.5 in specific populations). Age: average age for 22 inversions in which it can be calculated from the divergence between orientations using three different substitution rate estimates. Selection: summary of inversion selection signatures from FST, LSFS (positive or balancing selection) and NCD1 and NCD2 tests. Populations where the signal was detected are indicated by different colors in the corners of each cell, with alternating vertical and diagonal crosses to avoid visual overlap. Criteria for classification of strong and weak selection evidence are explained in Supplementary Data 7. Function: functional effects of inversions summarizing direct gene mutations, which include gene or transcript disruption (strong) or exchange of genic sequences (weak) (Supplementary Table 3), eQTLs in the GEUVADIS or GTEx datasets (showing the number of affected genes and labeled as strong if inversion is lead eQTL for at least one gene) (Supplementary Data 8 and Supplementary Data 9), and association with GWAS hits (strong if for one of the associations P < 1 × 10⁻⁶) (Supplementary Table 4) or GWAS signal enrichment (strong if enrichment empirical test P < 0.01 in both GWAS databases). Source data are provided as a Source Data file

