Fig. 3.
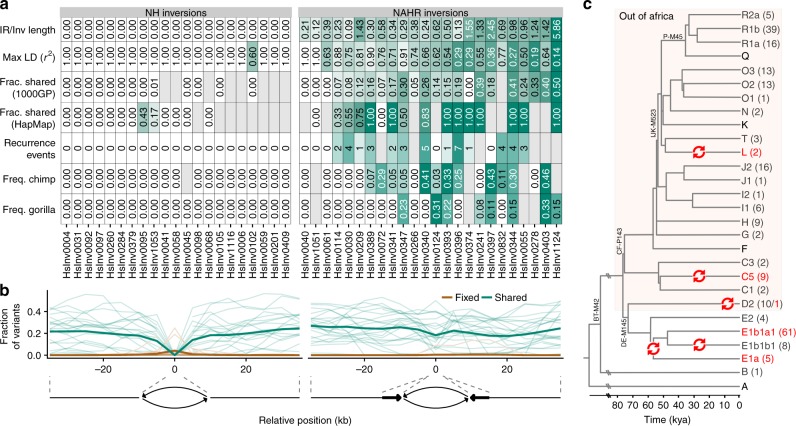
Evidence of unique or recurrent origin of NH and NAHR generated inversions. a Summary of the ratio between breakpoint IR and inversion length, maximum LD with neighboring variants in 1000GP and HapMap, fraction of shared SNPs inside the inverted region from the total number of SNPs analyzed in 1000GP or HapMap (which includes less SNPs and results in higher shared fractions), estimated number of recurrence events from haplotype analysis, and DAF or MAF for the inversions in non-human primates. Gray cells indicate values which could not be calculated. NAHR inversions show clear differences in LD with nearby variants, proportion of shared polymorphisms between orientations, recurrence events, frequency in ape species and other measures, with values that could be associated with higher levels of recurrence represented in stronger shades of green. b Distribution of fixed (brown) and shared (green) variants between the two orientations estimated from inversion genotypes and 1000GP data. The shared/fixed fraction with respect to the total number of polymorphic variants was computed for the whole inverted region plus 10-kb overlapping windows with a 5-kb step size in the flanking regions, and the horizontal axis represents the distance of the window central position to the inversion breakpoints (indicated by dashed lines). Thin lines represent individual inversions and thick ones represent the average for each inversion class. c Overview of the human chr. Y phylogenetic tree showing five different possible inversion events in the HsInv0832 region (red arrows). Divergence dates (bottom scale) and tree topology are based on Poznik et al77. For each chr. Y haplogroup, the number of males genotyped for HsInv0832 with each orientation is indicated in parenthesis (O1 in dark grey and O2 in red). Only the main branches and those including genotyped individuals are shown, with some characteristic mutations indicated in the tree. For haplogroup E, one of the two possible scenarios is represented, with the alternative being two inversion events in E1a and E1b1a1 haplogroups. Source data are provided as a Source Data file

