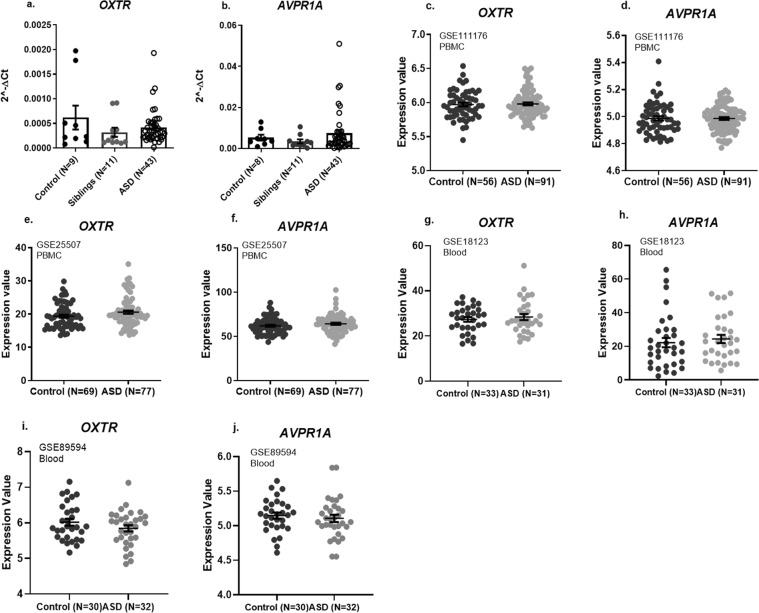
Figure 1.
Lack of differences in PBMC mRNA expression levels of OXTR and AVPR1A compared in ASD children, their neurotypical siblings, and neurotypical age-matched children. Findings are shown for our real-time PCR findings (a,b). Corroborating our findings, no differences between ASD and control children were found in Gene Expression Omnibus (GEO) datasets from PBMC (c–f) or whole blood (g–j) samples analyzed by datamining for their OXTR and AVPR1A expression. GSE codes and cohort sizes are shown. Note the large distribution of expression levels for OXTR and AVPR1A in both our PBMC samples (a,b) and the GEO datasets (c–j). Between-group differences were analyzed by one-way ANOVA test (a,b) and by Student’s t-test (c–j).

