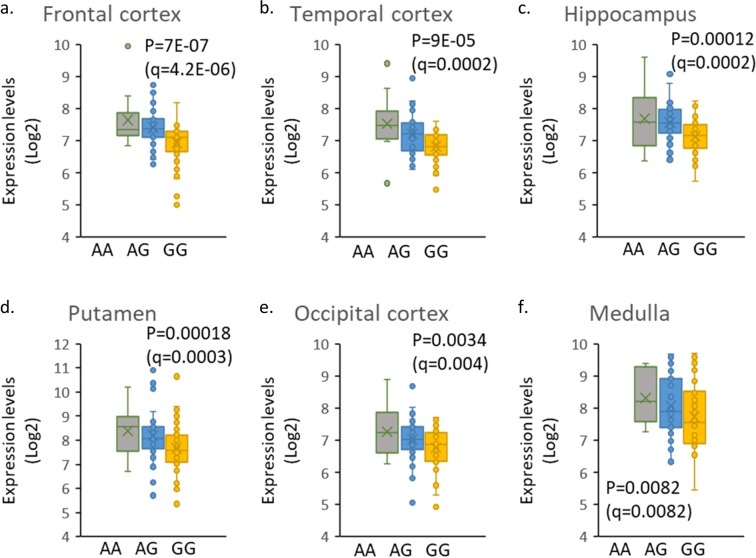
Figure 3.
OXTR brain expression levels according to SNP rs53576 alleles (AA, AG, GG). Datamining was performed on the Brain eQTL Almanac website (http://www.braineac.org/). Data were derived from postmortem brain tissues of 111 neuropathologically normal individuals for the following brain regions: (a) frontal cortex; (b) temporal cortex: (c) hippocampus; (d) putamen; (e) occipital cortex (specifically primary visual cortex); and (f) medulla (specifically inferior olivary nucleus). Genotype counts were AA = 10, AG = 48, GG = 53. P-values were calculated from the eQTL data by using MatrixEQTL software (according to braineac). P values were corrected for multiple testing using Benjamini-Hochberg FDR adjustment (q-values).

