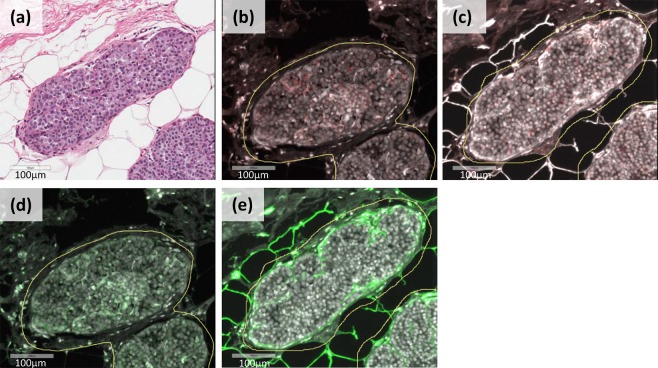
Figure 1.
Scanned images of a representative area of LCIS from a single case. The H&E-stained image (panel a) was used as a guide to mark the areas of epithelial tissue for analysis (annotations shown in yellow). Markers were stained using dual-immunofluorescence. MMP2 (panel b) and MMP9 (panel c) were visualized with Cy5 (red), whereas MMP14 (panel d) and collagen IV (panel e) were visualized with Cy3 (green). The images are shown at 20x magnification.

