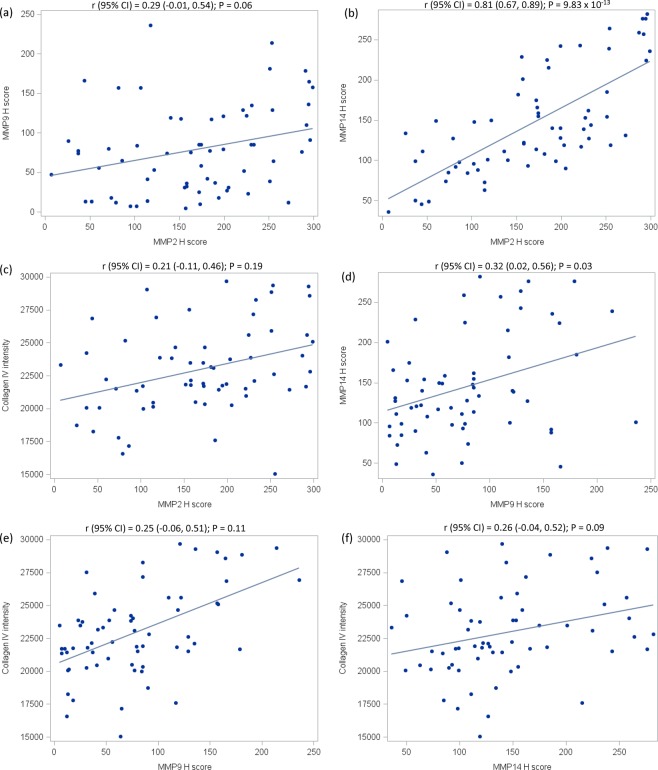
Figure 3.
Correlation between quantitative expression of MMP2, MMP9, MMP14, and collagen IV in 44 samples of normal breast epithelium from women diagnosed with LCIS at a single institution, 2004–2014. Panels a-f show pairwise relationships between expression of the MMPs 2, 9, and 14 and collagen IV. The associated Spearman correlation and 95% confidence interval are shown directly above each panel. The solid line shown in each plot represents the linear regression model-based fit line.

