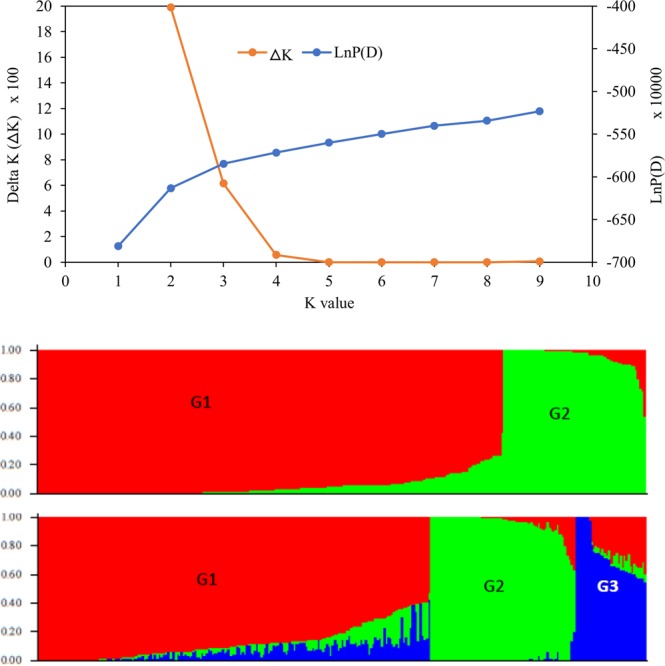
Figure 2.

Population structure of 298 maize inbred lines based on 22,500 SNPs in Dataset-3: (a) plot of LnP(D) and a ΔK calculated for K ranging from 1 to 10, with each K repeated thrice; (b) population structure of the 298 inbred lines at K = 2 and K = 3. Every line is represented by a single vertical line that is partitioned into K colored segments on the x-axis, with lengths proportional to the estimated probability membership (y-axis) to each of the K inferred clusters. For membership of each line, see Supplementary Table S1.
