Fig. 7.
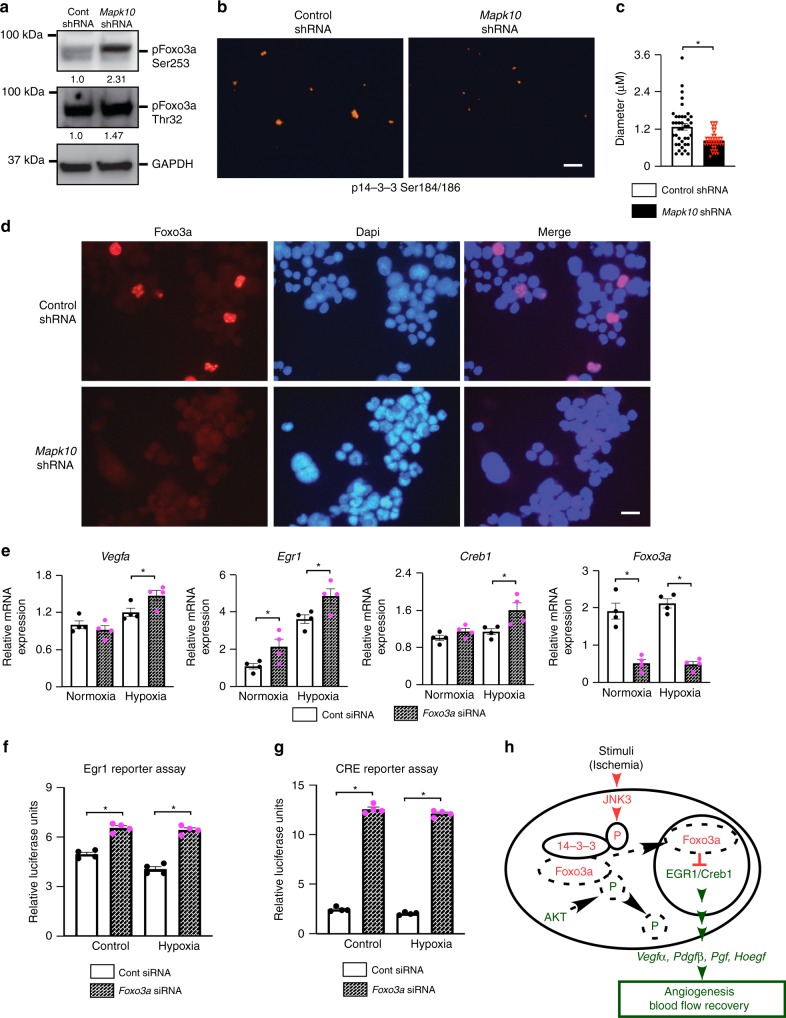
Foxo3a regulates the Egr1/Creb1 transcription factors activity and expression. a, b Neuro-2a cells were treated for 48–72 h with control or Mapk10 shRNA, lysates were prepared, and immunoblotting was performed with pFoxo3a (Ser253), pFoxo3a (Thr32), and Gapdh antibodies (a) and immunostaining was performed with p14-3-3 beta/zeta (Ser184/186) antibody (b). c p14-3-3 beta/zeta (Ser184/186) quantification, in N2a cell line after treatment with control or Mapk10 shRNA for 48–72 h (Control shRNA, n = 39; Mapk10 shRNA, n = 41). d Immunostaining was performed with Foxo3a antibody in Neuro-2a cells after either treatment with control or Mapk10 shRNA for 72 h. e RNA was isolated from control and Foxo3a siRNA-treated Neuro-2a cells and qRT-PCR was performed for genes as indicated (n = 5 in each group). f, g A Luciferase reporter assay for the Egr1 (f) and Creb1 (g) activity was performed on N2a cells treated with either control siRNA or Foxo3a siRNA (48 h) and 90 min of hypoxia (n = 4 in each group). h Schematic diagram of ischemia-induced JNK3 pathway during blood flow recovery. Statistically significant differences between groups are indicated (*P < 0.05 by Student’s t test). The data are mean ± SEM. Scale bar, 5 μm (b) and 20 μm (d). Source data are provided as a Source Data file

