Fig. 3.
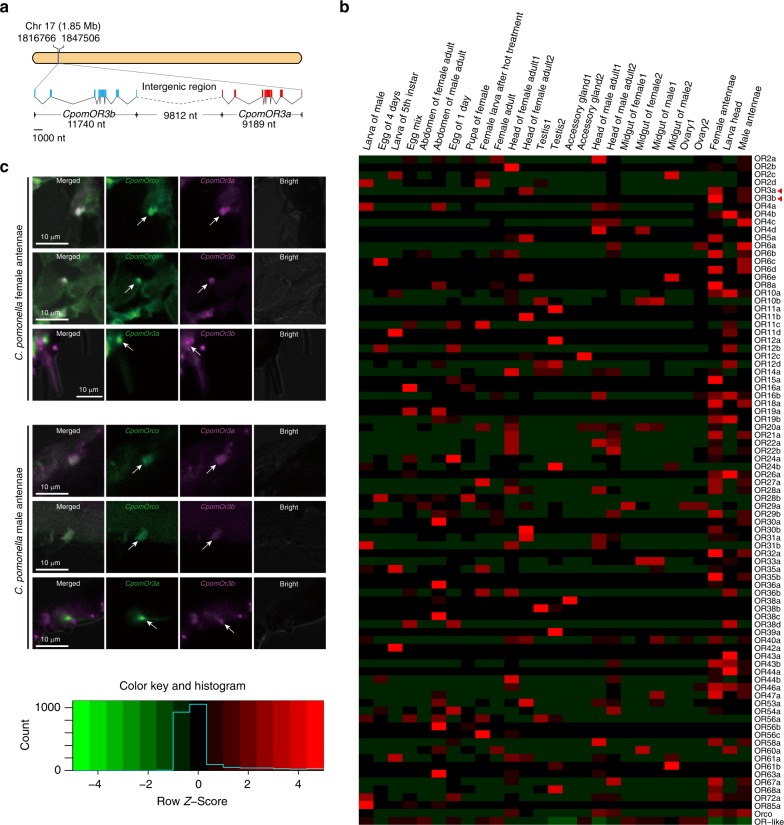
Structure and expression profiling of CpomOR3a and CpomOR3b in the codling moth, Cydia pomonella. a Exon–intron organization and chromosome location of CpomOR3a and CpomOR3b genes. The exon–intron organization of each gene was determined by sequence comparison between genomic sequences and putative cDNA sequences with BLASTN. The exons are shown as boxed regions (CpomOR3b: blue; CpomOR3a: red). The angled solid lines between boxes indicate the introns, while the angled dotted lines indicate the intergenic region. b Expression profiling of CpomOR3a and CpomOR3b in different tissues of C. pomonella. Estimation of abundance values determined by read mapping. Green indicates no to low expression, black indicates low to moderate expression, and red indicates moderate to high expression. Each data block shows the scaled z-score of FPKM value of the corresponded tissue/organ. The NCBI SRA accession numbers of all used transcriptomes were given in Supplementary Table 27. c Co-expression patterns of CpomOR3a, CpomOR3b, and CpomORco in C. pomonella antennae. Two-color FISH was used to label each pair of genes by probes with either digoxigenin (green) or biotin (purple). Upper panels: Female antennae expression. Lower panels: Male antennae expression. For both sexes, row 1: co-expression of CpomORco and CpomOR3a; row 2: co-expression of CpomORco and CpomOR3b; row 3: separated expression of CpomOR3a and CpomOR3b. Source data are provided as a Source Data file

