Fig. 1.
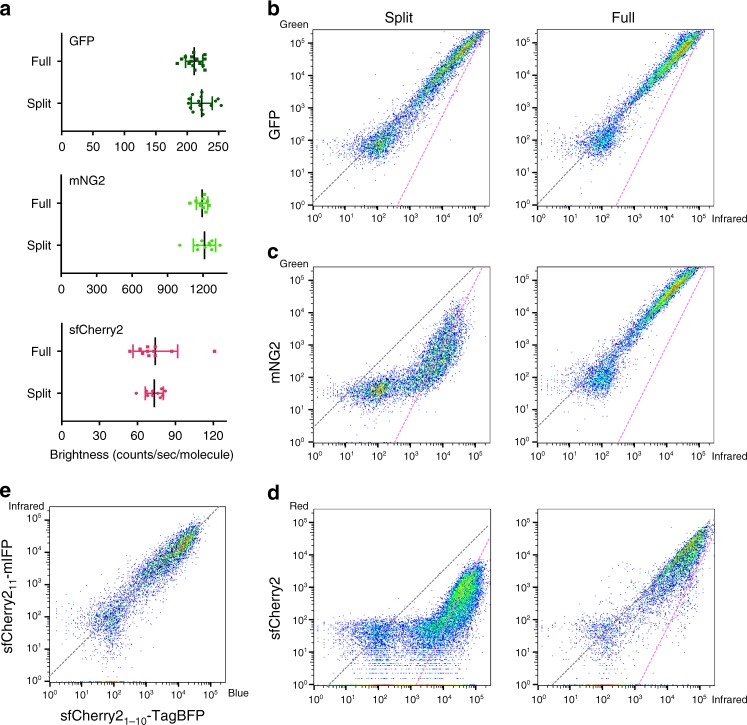
Characterization of split fluorescent proteins. a Single-molecule brightness measurement of split FPs and their full-length counterparts using fluorescence fluctuation spectroscopy. N = 10 (mNG2 and sfCherry5) or 15 (GFP) measurements. Error bars are standard deviations. See Supplementary Data for the list of data values. b–d Flow cytometry analysis of whole-cell fluorescence in HEK 293T expressing either b GFP1–10/11, c mNG21–10/11, and d sfCherry21–10/11 or their full-length counterparts. The x-axis is the log-scale infrared fluorescence intensity indicating the expression level, and the y-axis is the log-scale green (or red) fluorescence intensity. The gray dashed trend lines have a slope of 1 and intercepts are set to best follow the points in the right (full-length) panels. The pink dashed trend lines have a slope of 2 and intercepts set to best follow the points in the left (split) panels with the exception of GFP1–10/11. e Expression levels of two fragments are proportional within a wide range of expression levels in a co-transfect experiment. The gray dashed trend line has a slope of 1

