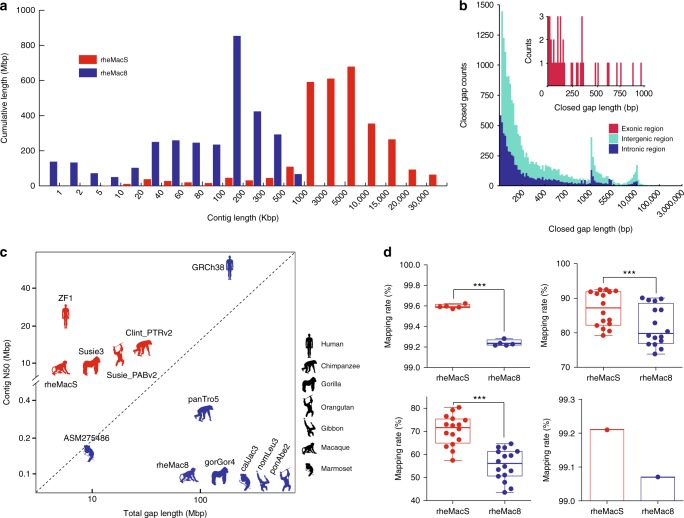
Fig. 2.
Quality assessment of the Chinese rhesus macaque genome assembly. a Comparison of sequence contig length distribution between rheMacS and rheMac8. b Length distribution of the closed gaps in rheMac8. c Comparison of assembly quality among various reported primate genome assemblies. Genomes assembled with long PacBio long reads (red) are compared against those assembled using Illumina short-read and Sanger sequencing data (blue). d Comparison of mapping rates when short-read NGS data (upper left), RNA-seq data (by Hisat2: upper right; by Bowtie2: lower left), and Iso-Seq data (lower right) are mapped to rheMacS and rheMac8, respectively. Two-tailed paired t test was used for statistical assessment. ***P < 0.001. The boxplot shows the mean value (central line), upper and lower quartiles (bounds of box) and min/max values (whiskers)

