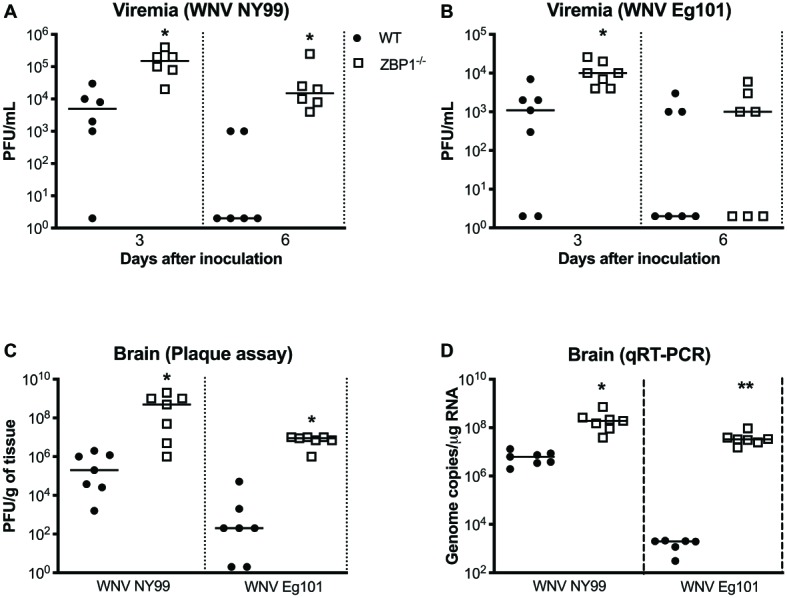
Figure 2.

Analysis of virus titers in WT and ZBP1−/− mice. Virus titers were measured in the serum at days 3 and 6 after (A) WNV NY99 or (B) WNV Eg101 infection by plaque assay and expressed as PFU/mL. (C) Virus titers were measured in brain homogenates (day 8 after infection with WNV NY99 or WNV Eg101) and expressed as PFU/g of tissue. (D) The WNV RNA copy number in the brain was determined by qRT-PCR and expressed as genome copies/μg of RNA (day 8 after infection with WNV NY99 or WNV Eg101). Each data point represents an individual mouse. The solid horizontal lines signify the median (n = 6–7 mice per group). *p < 0.05, **p < 0.001.
