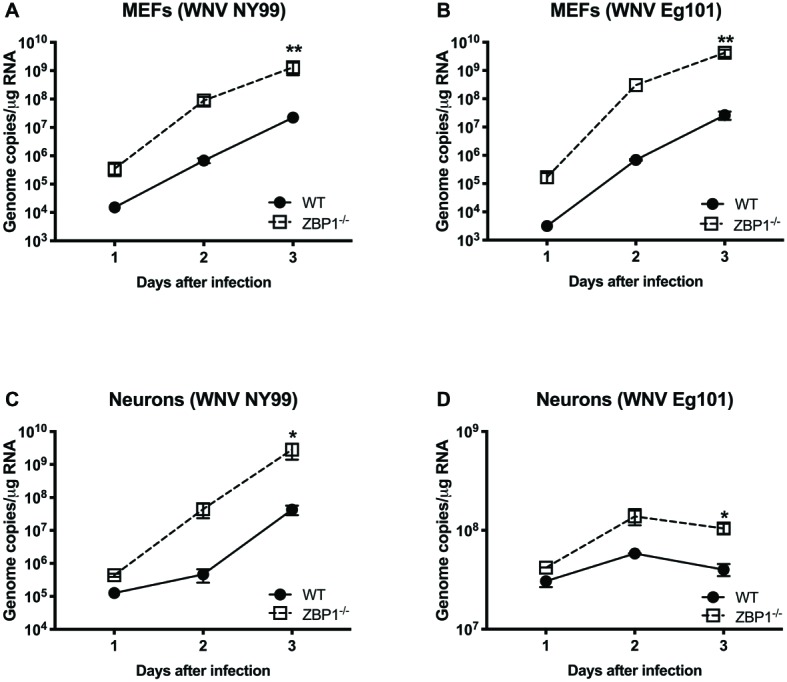
Figure 6.

Analysis of viral RNA levels in the primary cells isolated from WT and ZBP1−/− mice. (A–D) Cells were infected with WNV NY99 or Eg101 and total RNA extracted from cell lysates was used to conduct qRT-PCR to measure WNV RNA (expressed as genome copies/μg of RNA). Error bars represent SEM (three independent experiments conducted in duplicate), *p < 0.05, **p < 0.001.
