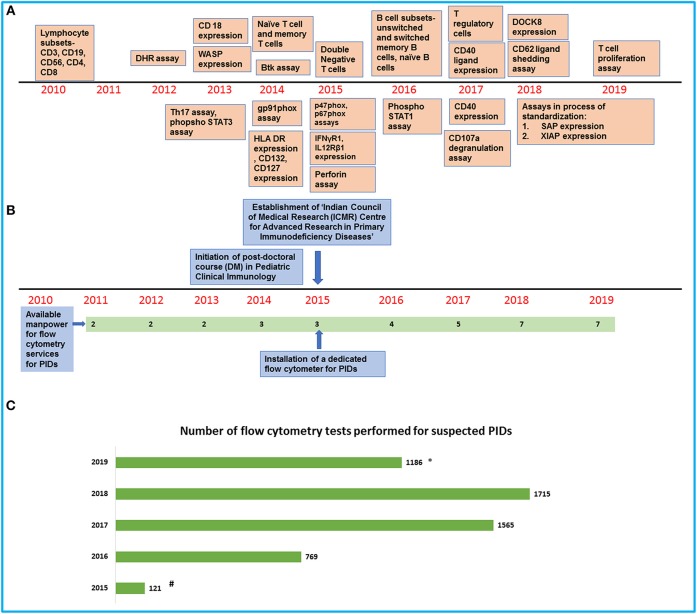
Figure 1.
An overview of development of flow cytometry services for PIDs at our center. (A) Timeline showing the establishment of flow cytometry tests in the laboratory. (B) Timeline showing the increase in manpower and support for the laboratory services. (C) Bar graph showing the number of flow cytometry tests for PIDs performed in our laboratory in the last 5 years (#Data available from August 2015 to December 2015/*Data available from January 2019 to July 2019).

