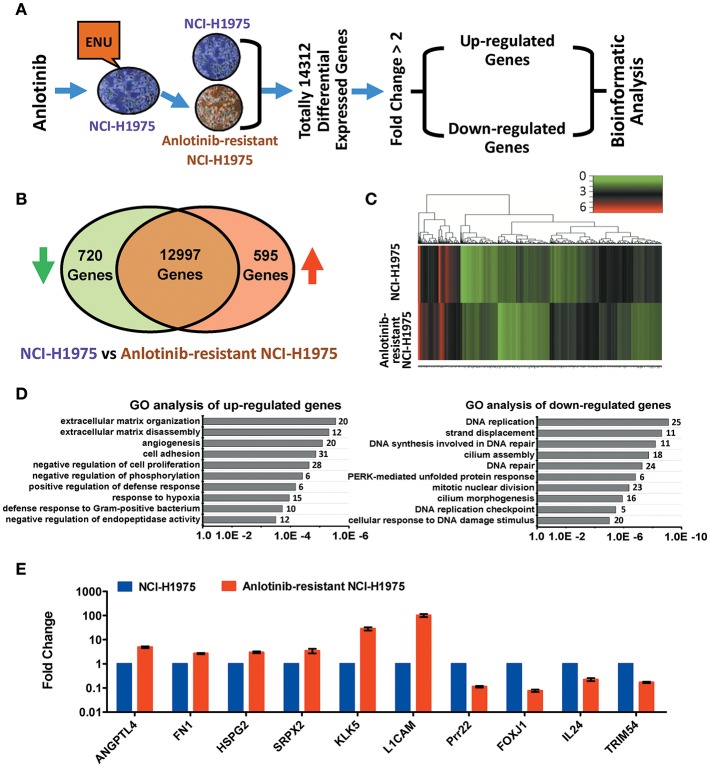
Figure 2.
Bioinformatics analysis of up-regulated and down-regulated genes in anlotinib-resistant NCI-H1975 cells. (A) Schema of multiple cross-check analysis for screening up-regulated and down-regulated genes in anlotinib-resistant NCI-H1975 cells. (B) Venn diagram analysis of differentially expressed genes that were modulated in anlotinib-resistant NCI-H1975 cells. The green arrow represents down-regulation and the red arrow represents up-regulation. (C) Heat map representation of differentially expressed genes that were modulated in anlotinib-resistant NCI-H1975 cells. (D) GO analysis of up-regulated genes and down-regulated genes in anlotinib-resistant NCI-H1975 cells. Numbers of enriched genes were shown on the right of column. (E) mRNA levels of potentially predictive genes detected by RT-qPCR in NCI-H1975 cells and anlotinib-resistant NCI-H1975 cells.

