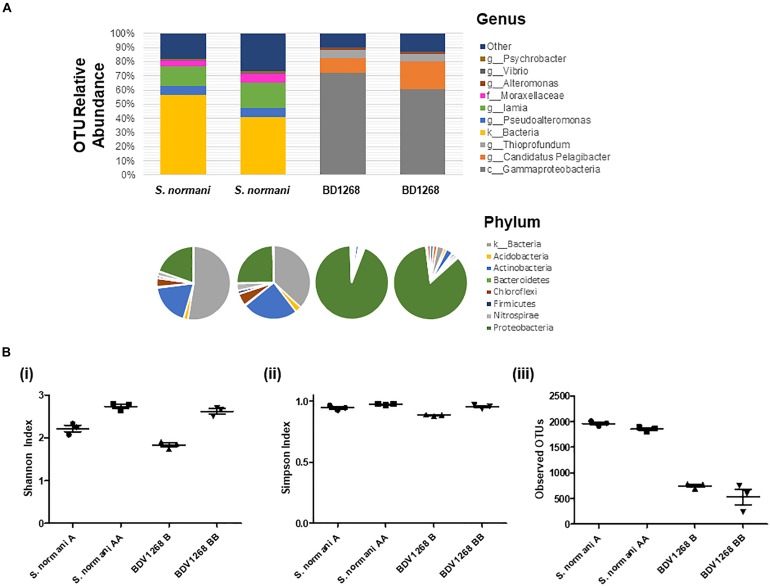
FIGURE 2.
(A) Microbiome 16S DNA bacterial community profiling of sponge DNA. Stacked charts show relative abundance at the genus level. Phylum community profiles are presented in pie-chart format above the corresponding genus-level stacked chart. Comparison with culturable microbiota reveals considerable challenge in activating the “silent” majority of genera present. Two independent samples were taken for each sponge and the average of three independent DNA extraction sequenced replicates is presented for each sample. (B) Diversity and OTU analysis on microbiome data (i) Shannon diversity index (H = –Σpi ln pi), (ii) Simpson diversity index, and (iii) OTU abundance.

