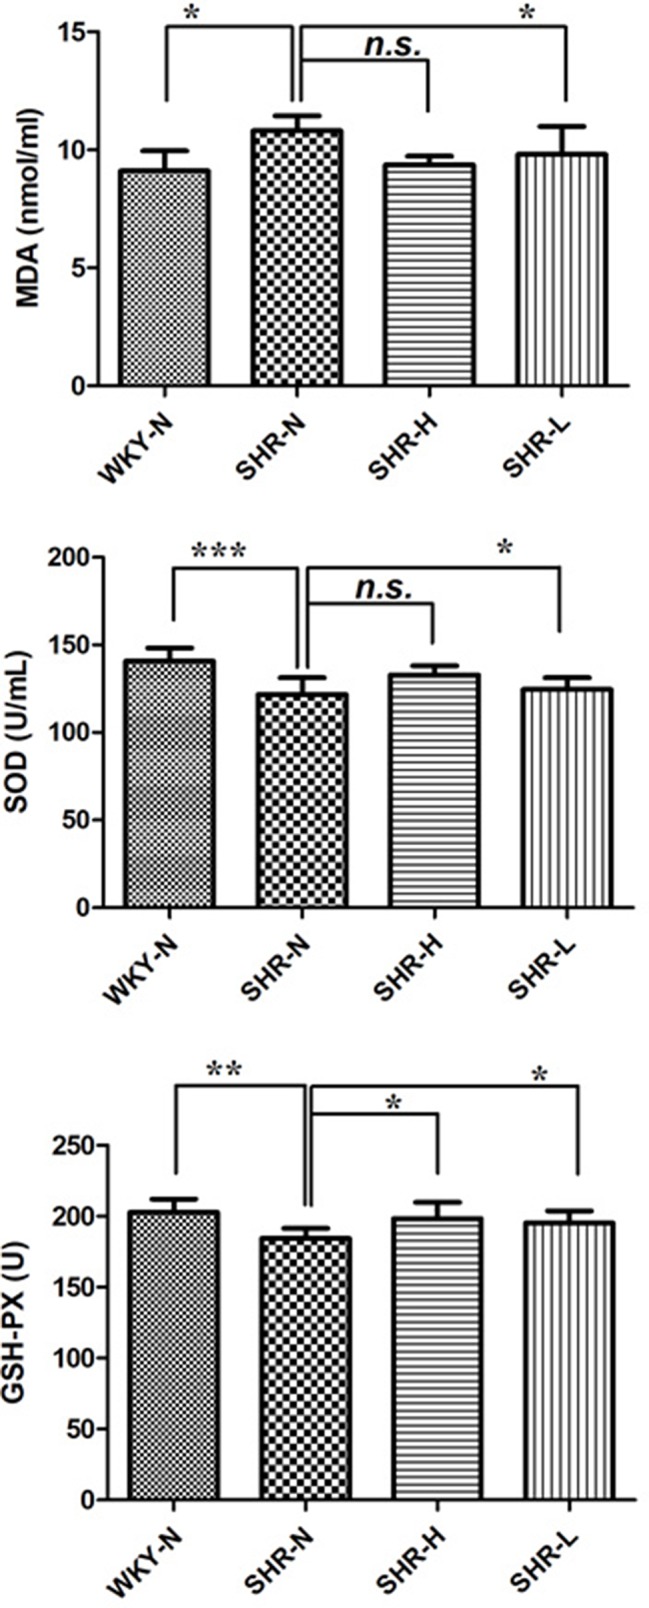
Figure 7.

Expressions of SOD, MDA and GSH-Px after treatment with TSC. Data are expressed as the mean ± SD and were analyzed by ANOVA. ***p < 0.0001, **p < 0.001, *p < 0.01, n.s.: p > 0.05.

Expressions of SOD, MDA and GSH-Px after treatment with TSC. Data are expressed as the mean ± SD and were analyzed by ANOVA. ***p < 0.0001, **p < 0.001, *p < 0.01, n.s.: p > 0.05.