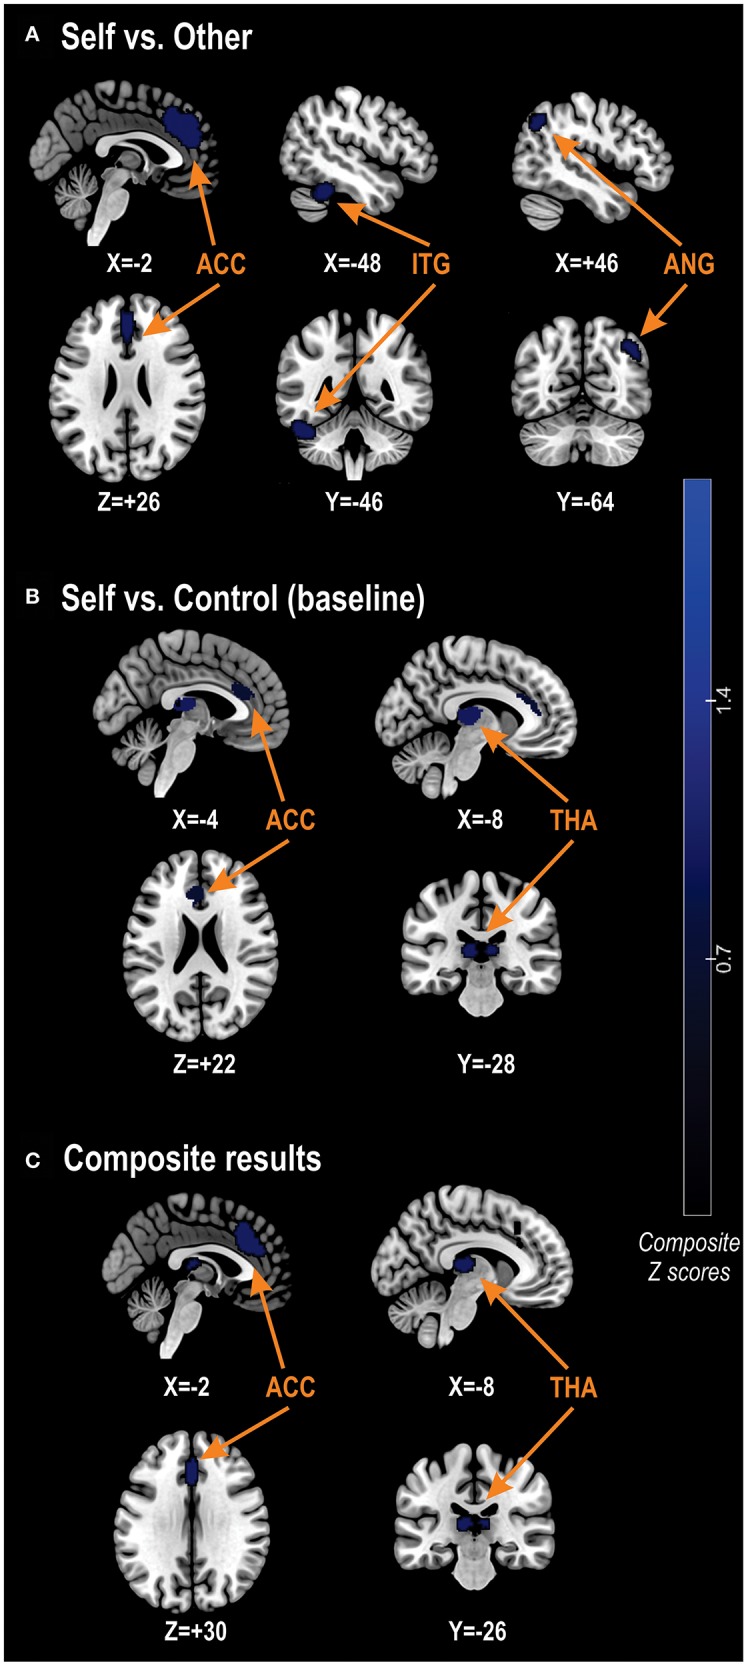
Figure 2.

Between-group differences in self-related brain activations. (A) Results for the between-group differences in brain activations using the Self vs. Other contrast. (B) Results using the Self vs. Control (baseline) contrast. (C) Results for the composite analysis, combining every studies including in the meta-analysis. ACC, anterior cingulate cortex; ANG, angular gyrus; ITG, inferior temporal gyrus; THA, thalamus.
