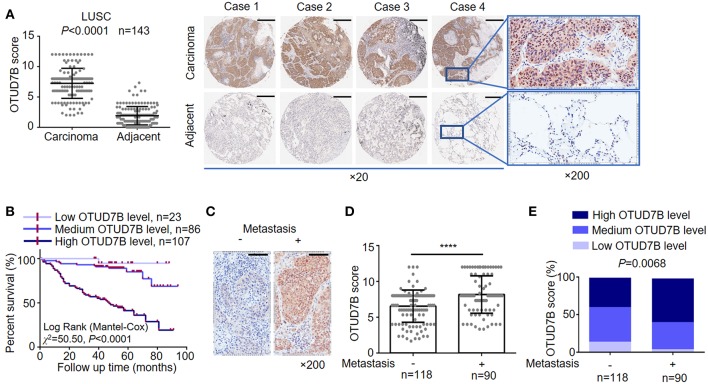
Figure 1.
OTUD7B is highly expressed in NSCLCs and correlated with a worse prognosis. (A) OTUD7B expression scores in LUSC and adjacent non-cancer tissues are shown as scatter dot plots. Small horizontal bars indicate the mean ± s.d. Each dot represents an individual sample. LUSC tissues were compared with matched adjacent non-cancer tissues using paired t-test. Right, Representative images of IHC staining of OTUD7B expression from 4 cases are shown. Magnification, ×20 (middle) and ×200 (right); scale bars, 400 μm. (B) Kaplan-Meier survival curve of high, medium and low OTUD7B level NSCLC. Marks on graph lines represent censored samples. P-value refers to two-sided log-rank tests. (C) Representative images from IHC staining of OTUD7B expression in tumors with or without metastasis (lymph node metastasis and distant metastasis) are shown. Magnification, ×200; scale bars, 100 μm. (D) Scatter dot plots of OTUD7B expression in the two groups of subjects described in (C) are shown. Data were analyzed using unpaired t-test and are shown as mean ± s.d. ****P < 0.0001. (E) The percentage of tumors in the two groups of subjects described in (C). Data were analyzed using Pearson's χ2 test.

