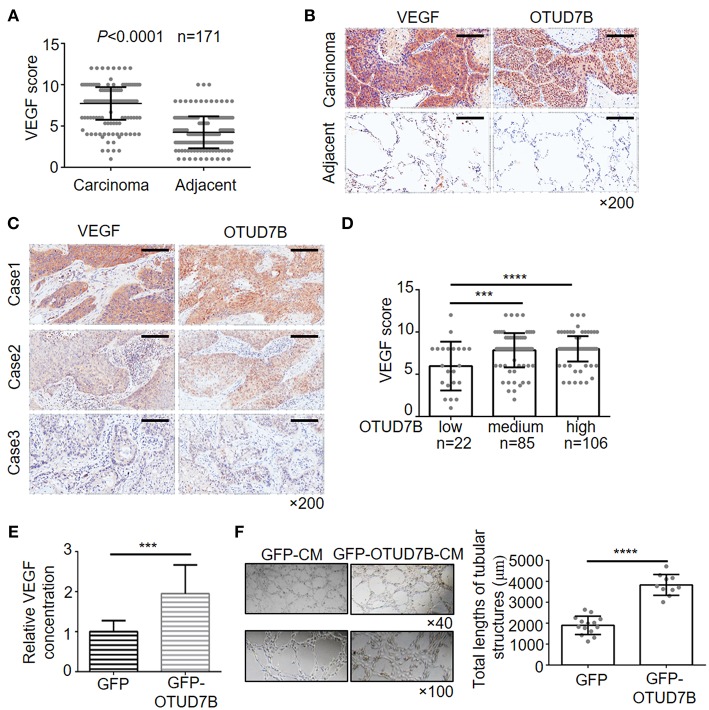
Figure 4.
Positive correlation of OTUD7B with VEGF expression and its role in VEGF production and angiogenesis. (A) The expression scores of VEGF (n = 171) were compared between NSCLC tumors and matched adjacent normal tissue using paired t-test. Data are shown as mean ± s.d. (B) Representative images from IHC staining of VEGF in the same NSCLC tumor. Magnification, ×200; Scale bars, 100 μm. (C) Representative images from IHC staining of VEGF and OTUD7B expression in two serial sections of the same tumor from three cases. Magnification, ×200; Scale bars, 100 μm. (D) Scatter dot plots of VEGF expression in NSCLC from 213 subjects. The subjects were divided into three groups based on OTUD7B expression scores in the tumors, representing low, medium and high expression of OTUD7B. Data were analyzed by one-way ANOVA and Tukey's multiple comparisons test. (E) Media from GFP- or GFP-OTUD7B-overexpressing NCI-H358 cells was removed, washed in RPMI-1640 with 0.5% FBS and incubated for an additional 24 h in RPMI-1640 with 0.5% FBS. GFP-conditioned media (GFPCM) and GFP-OTUD7B-conditioned media (GFP-OTUD7B-CM) were collected, and VEGF expression were analyzed by ELISA. Absorbance was measured at 450 nm. (F) EA.hy926 endothelial cells were pretreated with GFP-CM and GFP-OTUD7B-CM for 24 h. Subsequently, pretreated EA.hy926 cells were seeded on Matrigel for 8 h to observe tube formation. Representative photographs are shown (left). Tube lengths were quantitated using IMAGE-PRO PLUS software (n = 5 per group). Data are shown as mean ± s.d. ***P < 0.001, ****P < 0.0001.

