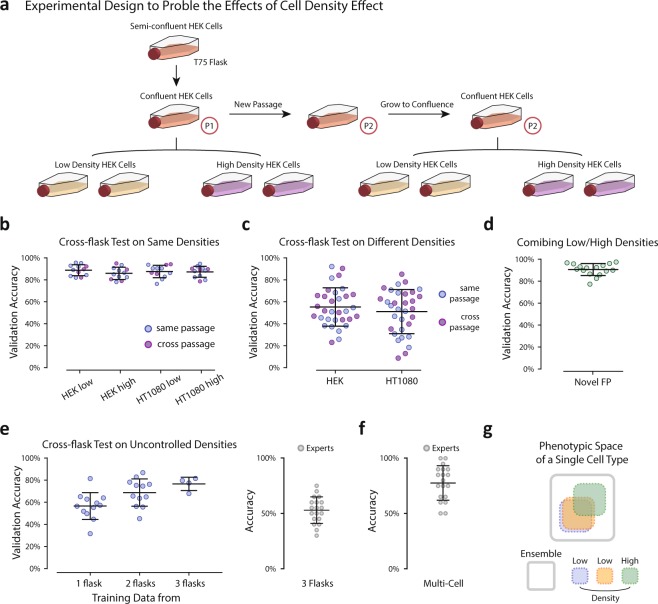
Figure 3.
Single cell seeding density significantly affects cell morphology. (a) Illustration of the experimental design to probe the effects of cell density across flasks. (Number of cells: HEK-293A low density 326 (P1), 352 (P2); high density 312 (P1), 313 (P2); HT1080 low density 507 (P1), 621 (P2); high density 556 (P1), 504 (P2)). (b) Cross-flask tests with conserved densities (e.g. high density training/high density validation, low density training/low density validation). Tests for which the training and validation data were both from the same passage were labeled blue and tests for which the training and validation data were from different passages were labeled purple. There was no observed dependence on passage number. (c) Cross-flask tests across densities (e.g. high density training/low density validation, low density training/high density validation) and colored according to passage as in (b). (d) Training on both densities and generalizing to a novel flask pair with uncontrolled density. (e) Left: Training on pools of images from flask pairs of uncontrolled density and generating to novel flask pairs of uncontrolled density. Right: expert classification training on 3 uncontrolled flask pairs and generalizing to a novel flask pair of uncontrolled density. (f) Expert classification for multi-cell frame classification of two cell types. (g) Illustration of the proposed distribution of single cell morphological phenotypes within a single cell type across flasks of different densities.

