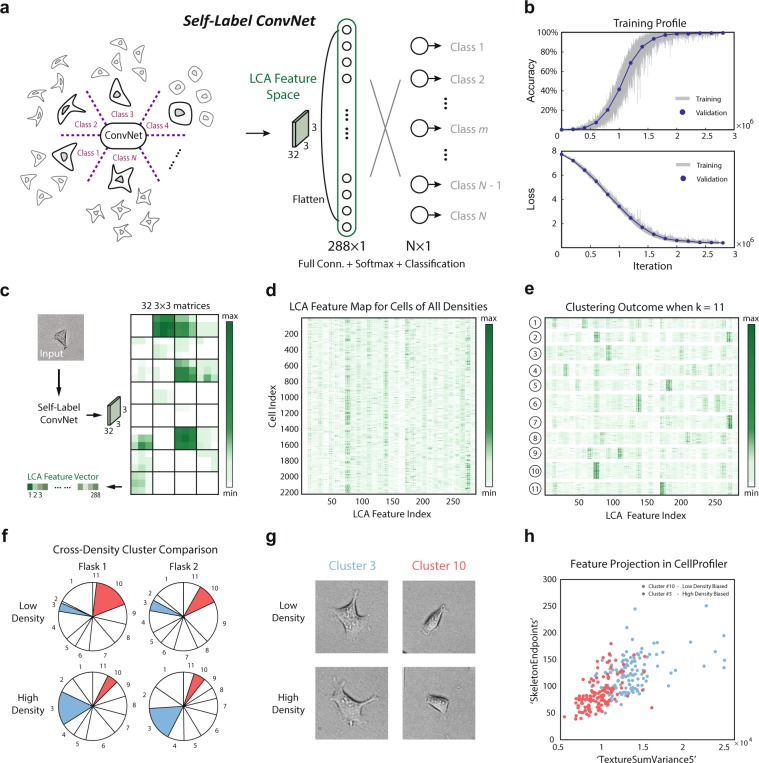
Figure 5.
Self-Label Clustering is able to identify distinct morphological phenotypes within a single cell type. (a) Illustration of the Self-Label ConvNet architecture. The group of augmented copies for each cell are considered unique classes, yielding the same number of classes in the final layer as there are cells used to train the network. The [l]ast [c]onvolutional [a]ctivation or’LCA’ feature space, labeled in green, is the structure of interest for the following morphological phenotype clustering. (b) Training profile of Self-Label ConvNet. An accuracy of nearly 100% can be achieved for both training data and validation data, and a Softmax loss of nearly 0 can be achieved for both training data and validation data. (c) Workflow for acquiring the LCA Feature Space for an example cell. Novel cells are input into the pre-trained Self-Label ConvNet and the activations of the last convolutional layer are recorded as 32 3 × 3 matrices for each cell input. The matrices are then flattened to a vector of length 288, each element representing one’feature’ of the input cell. (d) LCA matrix: LCA Feature Maps for many cells across all densities (2208 cells total) were displayed as rows in a matrix (size 2208 × 288) with each column representing one feature in the LCA. (e) Clustering outcome for the LCA matrix applying k-means to rows according to Euclidean distance with k = 11. Clusters were shown after reshuffling the cell indices based on their cluster index.. (f) Cross-density cluster comparison. Two flasks of two densities were shown. For each flask, the fraction of cells belonging to each of the k = 11 clusters was displayed. Clusters with significantly different representations between densities were colored. (g) Representative cell images of the clusters #3 and #10 for two densities of cells. (h) Morphological Analysis: Two clusters of cells dominated by low density (cluster #10) and high density (cluster #3) respectively, were analyzed. Morphological properties for cells within these clusters were calculated with CellProfiler, and two features (SkeletonEndpoints and TextureSumVariance5) were chosen to generate a 2D projection, illustrating clear distinguishability in a low dimensional morphological feature space. High density biased cluster (cluster #3) was labeled in red and low density biased cluster (cluster #10) was labeled in blue.

