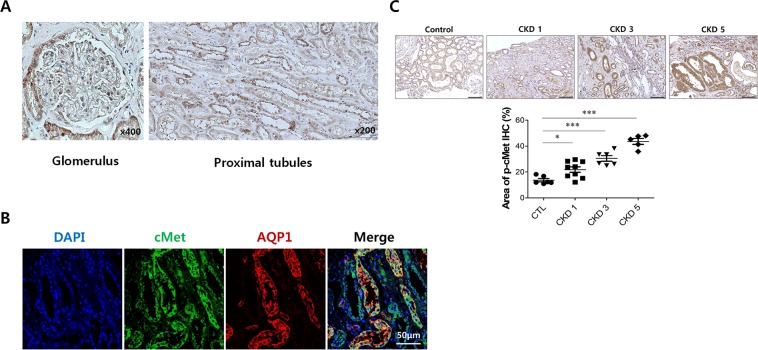
Figure 1.
cMet expression in normal human kidney tissue. (A) Representative images of IHC staining for cMet in the glomerulus and tubulo-interstitium from normal human kidney tissue. Original magnification: X400 (Left), X200 (Right). Scale bar, 100 µm. (B) Representative confocal microscopy images of human kidney biopsy samples from human normal kidney tissues; the samples were costained for cMet (green), aquaporin-1 (red) and DAPI (blue). Original magnification: X200. (C) Representative images of phospho-cMet expression in IgAN patients. Original magnification: X200. Scale bar, 100 µm. Symbols represent individual data points, horizontal bars indicate the mean, and error bars indicate SEM (*p < 0.05, ***p < 0.001).

