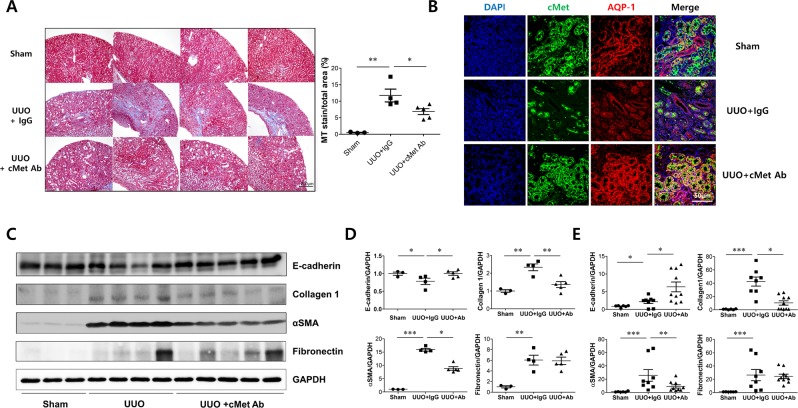
Figure 4.
cMet agonistic Ab and kidney fibrosis in a unilateral ureteral obstruction (UUO) mouse model. (A) Representative images of kidney sections stained with Masson’s trichrome stain in IgG control- or cMet Ab-treated mice at day 14 after UUO. Original magnification: X20. Scale bar, 200 µm. Symbols represent individual data points, horizontal bars indicate the mean, and error bars indicate SEM. (B) cMet expression in proximal tubular cells in n IgG control- or cMet Ab-treated mice at day 14 after UUO. DAPI (blue), cMet (green), and aquaporin-1 (red).Original magnification: X400. Scale bar, 50 µm. (C,D) The expression levels of fibronectin and collagen 1 were increased and those of E-cadherin were decreased in the cMet group, and treatment with the cMet agonistic Ab prevented fibrosis as indicated by western blot. (E) Quantitative RT-PCR analyses of the indicated mRNA transcript showed similar expression patterns as those observed by western blot. The combined data represent at least 2 independent experiments with similar results. Symbols represent individual data points, horizontal bars indicate the mean, and error bars indicate SEM (*p < 0.05, **p < 0.01, ***p < 0.001).

