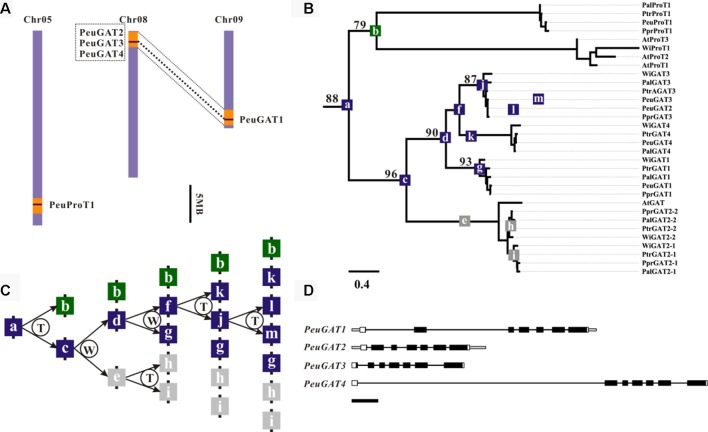
Figure 2.
Genomic localization, phylogenetic relationships, and hypothetical duplication histories of the PeuGAT genes. (A) Regions that are assumed to correspond to homologous genome blocks are shaded in orange and connected with lines. (B) Phylogenetic relationships were reconstructed using the WAG + I + G model. Numbers on branches indicate the bootstrap percentage values calculated from 1,000 bootstrap replicates. (C) The letters T and W in the schematic diagram showing the hypothetical origins of PeuGAT genes indicate tandem duplication and whole-genome duplication, respectively. Gray boxes represent the presumed pseudogenes or lost genes. Blue and green boxes represent PeuGAT and PeuProT genes, respectively. (D) The Aa_trans-coding domain is colored black, and the remaining exon sequences are shown as white boxes. Gray boxes represent untranslated regions, while lines represent introns. Scale bar: 500 bp.

