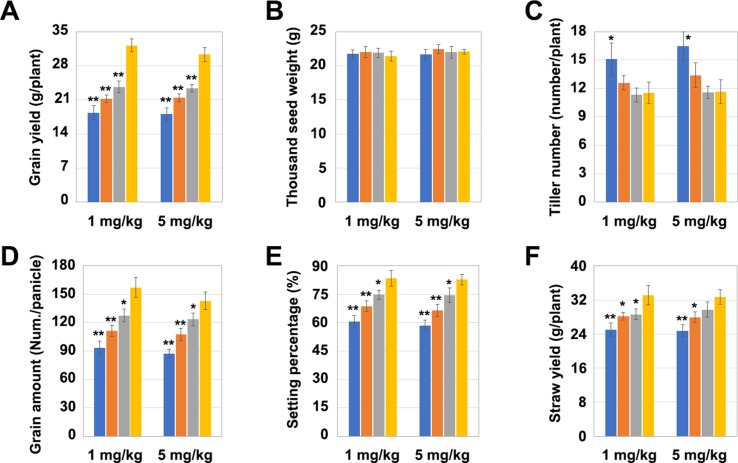
Figure 4.
Effects of different mutation types of OsNramp5 on rice yield. (A)–(F) Statistical analysis of the yield per plant, 1,000 grain weight, number of tillers, grain number per ear, seed-setting rate, and straw yield of OsNramp5 mutants LCH1, LCH2, and LCH3 and control after treatment with Cd of 1 and 5 mg/kg concentrations. The blue columns represent LCH1; the orange columns represent LCH2; the gray columns represent LCH3; the yellow columns represent control. Data are given as means ± SD, with three biological replicates. * or ** significant difference (P < 0.05 or 0.01, respectively, t-test)

