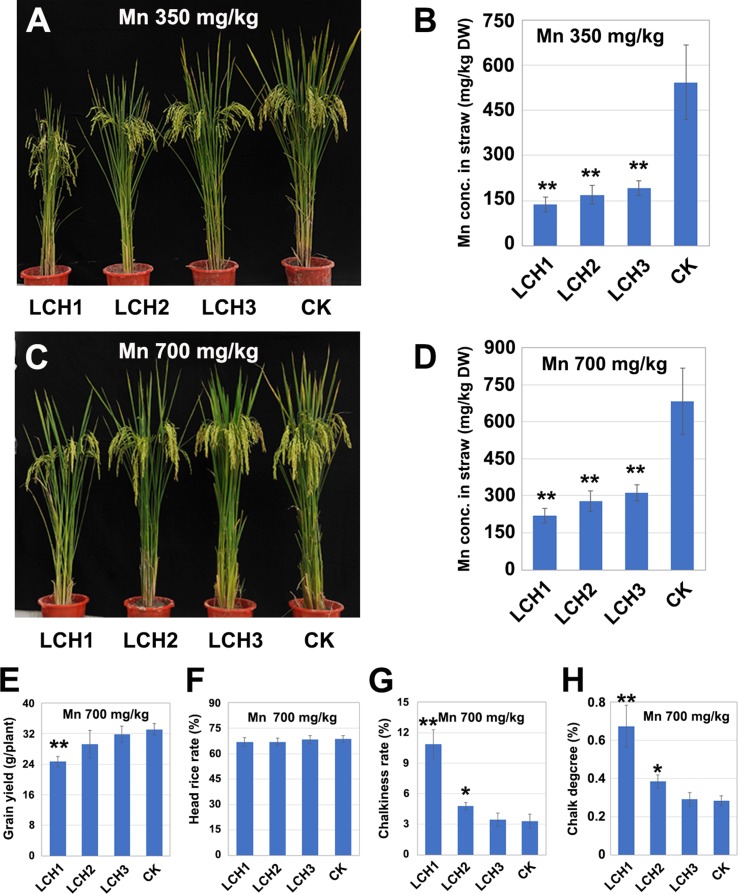
Figure 6.
Relationship between Mn concentration in the chlorenchyma of mutants and the yield and quality of rice. (A) Phenotype of LCH1, LCH2, LCH3, and control with a soil Mn content of 350 mg/kg. (B) Mn content in chlorenchyma of LCH1, LCH2, LCH3, and control at maturity with a soil Mn content of 350 mg/kg. (C) Phenotype of LCH1, LCH2, LCH3, and control with a soil Mn content of 700 mg/kg. (D) Mn content in chlorenchyma of LCH1, LCH2, LCH3, and control at maturity with a soil Mn content of 700 mg/kg. (E) Yield of LCH1, LCH2, LCH3, and control with a soil Mn content of 700 mg/kg. (F) Milled rice rate of LCH1, LCH2, LCH3, and control with a soil Mn content of 700 mg/kg. (G) Chalky grain rate of LCH1, LCH2, LCH3, and control with a soil Mn content of 700 mg/kg. (H) Chalkiness degree of LCH1, LCH2, LCH3, and control with a soil Mn content of 700 mg/kg. Data are given as means ± SD, with three biological replicates. * or ** significant difference (P < 0.05 or 0.01, respectively, t-test)

