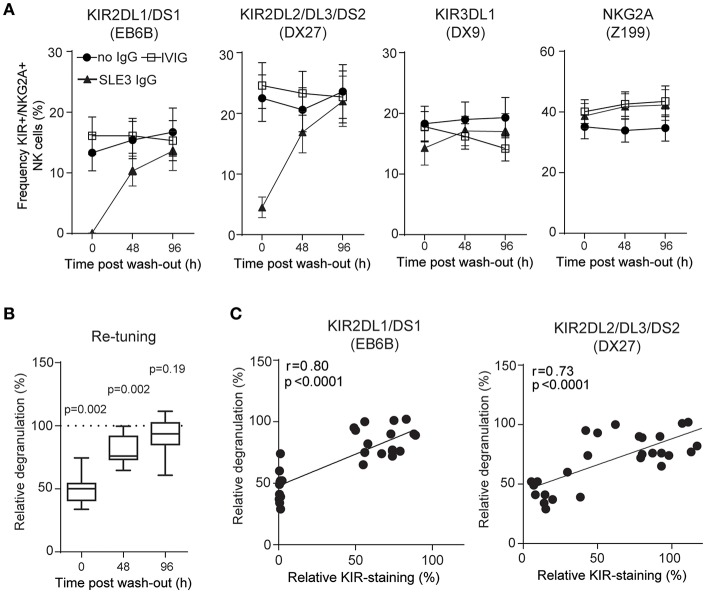
Figure 4.
NK cells retune following wash-out of IgG. (A) Surface stainings of indicated NK cell receptors, and (B) degranulation of NK cells from 10 HDs was determined before (0 h), and after wash-out of IgG (48 and 96 h). Degranulation of NK cells treated with IgG from SLE3 relative to IVIG-treated cells. Data are shown as (A) mean values with error bars representing the standard error of the mean, and (B) boxplots with median, interquartile range, and range. (B) The one-sample t-test was used to assess whether the relative degranulation differed from 100%. (C) Correlation between data in (A,B). The p-values and Pearson's correlation coefficients (r) from linear regressions are denoted.

