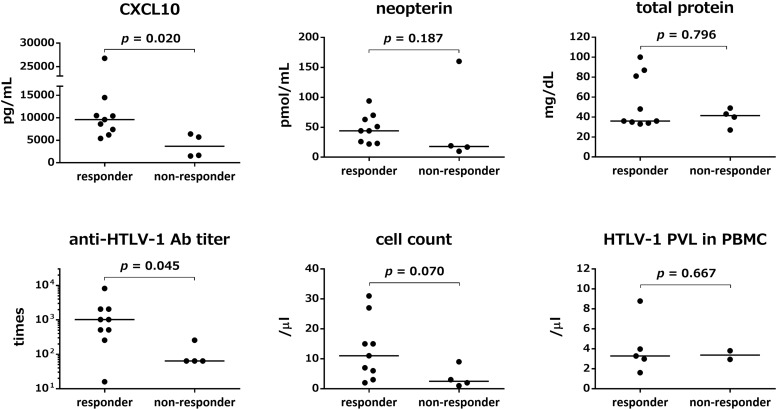
FIGURE 2.
Comparison of pre-treatment marker values between responders and non-responders to steroid therapy. Responders (n = 9) refer to patients who showed improved Osame motor disability scores (OMDS) by one or more grade 1 month after the start of steroid therapy. Non-responders (n = 4) refer to patients who did not show any change in OMDS. The pre-treatment values of five CSF markers (CXCL10, neopterin, total protein, anti-HTLV-1 antibody titer, and cell count) and HTLV-1 proviral load in Peripheral blood mononuclear cells (PBMCs) were compared between responders and non-responders. Data were analyzed by Mann–Whitney U test. Ab, antibody; PVL, proviral load; PBMC, peripheral blood mononuclear cells.

