Figure 5.

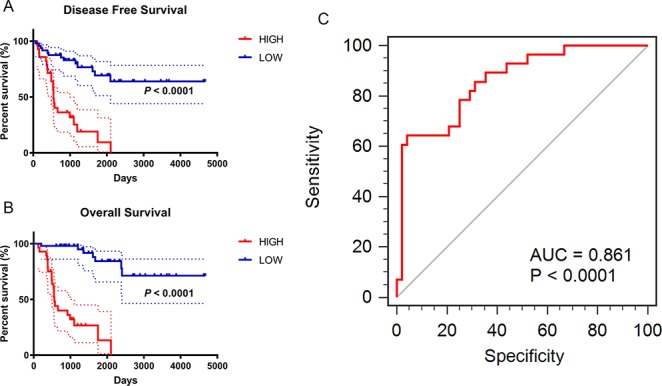
Prognostic and diagnostic value of integrated significant molecular score in ACC samples after LASSO Cox regression. (A–B) Kaplan–Meier method was used to perform the significant survival outcomes (DFS: P < 0.0001; OS: P < 0.0001). (C) ROC curves of the integrated models were synchronously plotted to predict diagnosis probability. Red line represents integrated expression score with AUC of 0.861 (P < 0.0001).
