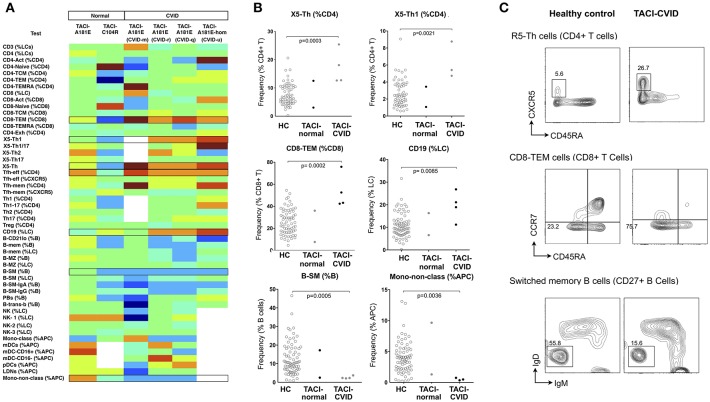
Figure 4.
Analysis of cellular parameters in CVID patients carrying TACI variants in comparison to TACI mutant control subjects without CVID. (A) Heat mapping with discontinuous shading for four unrelated CVID patients carrying the TACI A181E allele, one homozygous, along with two healthy individuals with A181E, or C104R alleles. Boxes highlight parameters for which cellular changes differ in those with CVID compared with TACI controls. (B) Scatter plots showing raw values for populations identified in (A), along with representative FCM contour plots of these critical parameters (C). Raw and centile data is presented in Supplementary Table 3.

