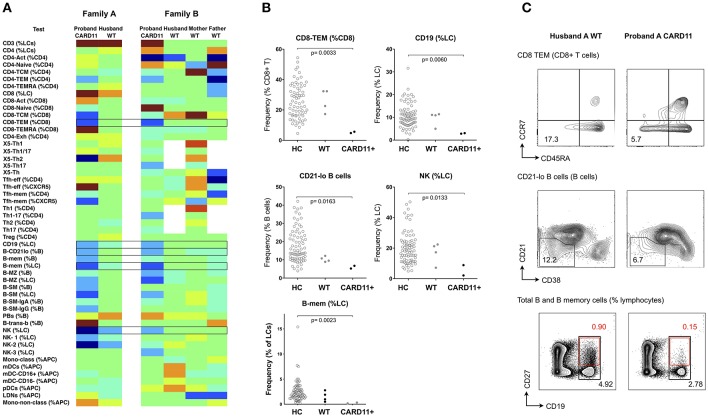
Figure 6.
Analysis of cellular parameters in a CARD11 mutant kindred. (A) Heat mapping with discontinuous shading showing changes in cell populations for two unrelated patients with dominant negative CARD11 mutations, along with their relative(s) without mutation. Boxes highlight cellular changes common to the two CARD11 mutants, but differing from the family members. (B) Scatter plots showing raw values for populations identified in (A), along with representative FCM contour plots of these critical parameters (C); in the B-cell contour plot, black boxes and numbers refer to total CD19+ cells, and red boxes and numbers refer to CD19+/CD27+ memory B cells. Raw and centile data is presented in Supplementary Table 3.

