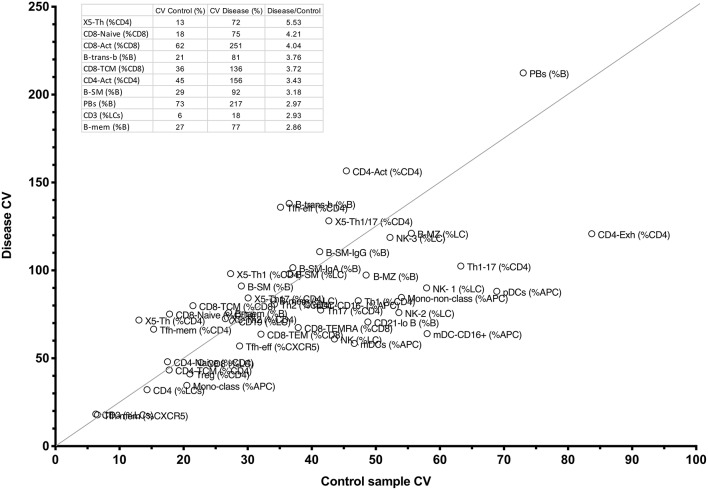
Figure 7.
Comparison between CV percentages of 51 cellular parameters derived from the internal FCM control, and the same variation in the entire CPI cohort with widely varying immune conditions (see section Methods). The line shows the cut-off for the top 10 parameters with the highest ratio of disease-driven variation divided by internal variation, and these 10 parameters, and corresponding raw values appear in the table inset.

