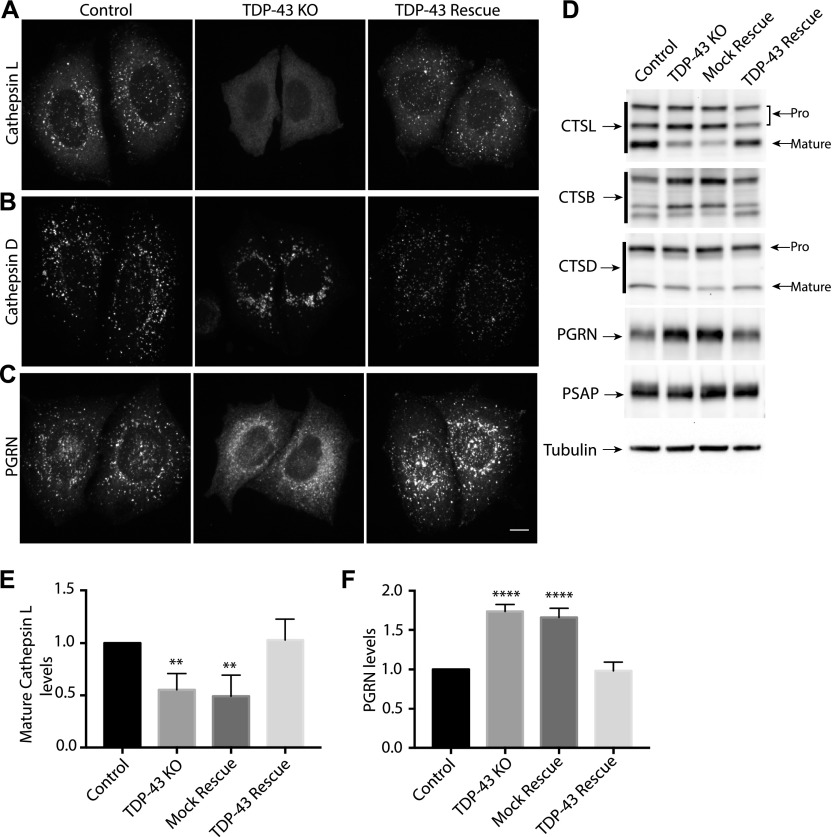
Figure 3. Characterization of lysosome-related defects in TDP-43 KO cells.
(A) Representative confocal images of Cathepsin L localization in WT, TDP-43 KO, and rescued HeLa cell lines, respectively. (B) Cathepsin D localization in cells of the indicated genotypes. (C) Impact of TDP-43 on PGRN subcellular localization. Representative images are presented from three biological replicates for experiments that are summarized in panels (A, B, and C). Scale bar = 10 μM. (D) Immunoblot analysis of lysosomal protein abundance and processing in cells of the indicated genotypes. Mock rescue refers to TDP-43 KO cells stably expressing empty vector. (E) Quantification of the TDP-43–dependent changes in the abundance of the mature form of cathepsin L (n = 4 biological replicates, P < 0.005, ANOVA with Bartlett posttest). (F) Quantification of TDP-43–dependent changes in PGRN protein levels (n = 4 biological replicates, **P < 0.0001, ANOVA with Bartlett posttest). Error bars show mean ± SEM.

