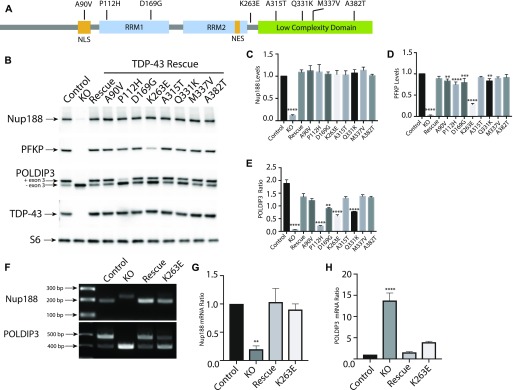
Figure 5. ALS-linked TDP-43 mutations selectively rescue the regulation of specific TDP-43 targets.
(A) Schematic diagram that summarizes the TDP-43 protein domain organization and the location of mutants that were investigated in this study. (B) Representative immunoblots from control, TDP-43 KO, and TDP-43 KO HeLa cell lines that were reconstituted with TDP-43 variants containing the indicated ALS causing mutations. (C) Quantification of the ability of mutant forms of TDP-43 to rescue Nup188 abundance (n = 3 biological replicates; ****P < 0.0001; ANOVA with Dunnett’s multiple comparison test, comparison with WT). (D) Quantification of PFKP abundance (n = 3 biological replicates; ****P < 0.0001, ***P < 0.0006, and **P < 0.0054; ANOVA with Dunnett’s multiple comparison test to compare mutant cell lines with WT). (E) Ratio of the POLDIP3 exon 3 inclusion (n = 3 biological replicates; ****P < 0.0001, ***P < 0.0003, and **P < 0.0016; ANOVA with Dunnett’s multiple comparison test to test for differences between the mutant cell lines versus WT rescue samples). Error bars show mean ± SEM. (F) RT-PCR showing effects of rescue with WT, TDP-43, and K263E mutant on Nup188 and POLDIP3 splicing. (G, H) Quantification of RT-PCR results for Nup188 and POLDIP3, respectively. In both cases, the density of the lower bands were measured using ImageJ and divided by the density of the upper bands. Results were normalized to control (n = 3 biological replicates; **P < 0.0067 and ****P < 0.0001; ANOVA with Dunnett’s multiple comparison test). Error bars show mean ± SEM.

