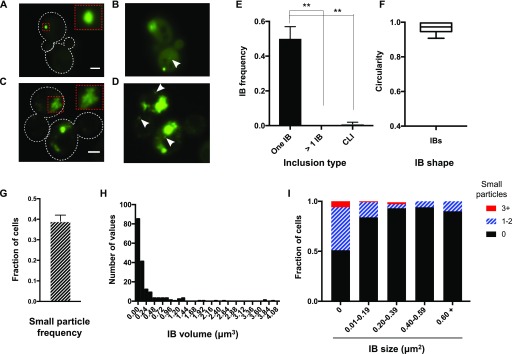
Figure 1. Mutant Htt typically forms a single ovoid IB, accompanied by small particles.
(A) Mutant Htt(72Q)-GFP in mid-log–phase cells forms a single, ovoid, uniformly fluorescent IB. A single optical section is shown. Cell outlines are indicated by dotted white lines. Inset shows enlarged version of area indicated by dotted red rectangle. Bar, 2 μm. (B) Small particles are sometimes seen (arrowhead); a single optical section is shown, from the same z-series as in (A), but in a different imaging plane and with enhanced contrast. (C) In a small fraction of cells, mHtt(72Q)-GFP is found in asymmetric CLIs. Cell outlines are indicated by dotted white lines. Inset shows enlarged version of area indicated by dotted red rectangle, showing inhomogeneous intensity of the CLIs. A single, representative optical section is shown. Bar, 2 μm. (D) Numerous smaller inclusions often accompany a CLI (arrowheads). A single optical section is shown, from the same z-series as in (C), but in a different imaging plane and with contrast enhanced to reveal the smaller inclusions. (E) In mid-log cells, single IBs are significantly more prevalent than either multiple IBs or CLIs. Cells were in mid-log phase and had been growing for at least 10 doubling times. The mean of three trials is shown, n = 166 cells total. Error bars represent SEM. **P < 0.01, ANOVA and unpaired two-tailed t test. (F) Ovoid IBs are approximately circular (whiskers indicate minimum and maximum values; n = 16 IBs with diameters over 0.4 μm). (G) Quantitation of the frequency of small particles in the same cells quantified in (E); error bars indicate SEM. (H) Histogram of apparent IB volumes calculated from 3D series (n = 184). (I) The fraction of cells containing 0, 1–2, or 3 or more small particles was determined in cells with different IB sizes (defined as maximal apparent cross-sectional area). n = 48–233 cells per category.

