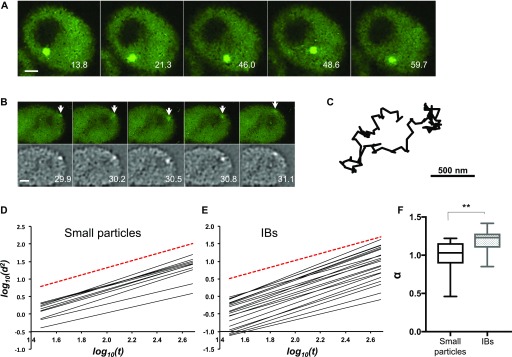
Figure 2. Inclusions and small particles of aggregated mHtt are mobile.
(A) Representative time-lapse sequence of an IB moving within the cytoplasm. Numbers indicate elapsed time in seconds. Bar, 1 μm. (B) Representative time-lapse frames showing a small particle (arrows). Upper panels, denoised images; lower panels, the same images processed with the SpotTracker Spot Enhancing Filter 2D. Numbers indicate elapsed time in seconds. Bar, 1 μm. (C) Track of the particle indicated in (B). (D, E) The log of mean squared displacement (d2) is plotted against the log of time (t) for 23 small particles (D) or 23 IBs (E). Each fitted line is derived from a single small particle. The slope of the line gives the value for the exponent α in the diffusion equation. The red dashed reference line shows α = 1 (random diffusion). A slope >1 indicates directed movement. (F) The average value of α was determined for small particles and IBs. **P = 0.0006, unpaired two-tailed t test with unequal variance, n = 23 for each group; whiskers indicate minimum and maximum values.

