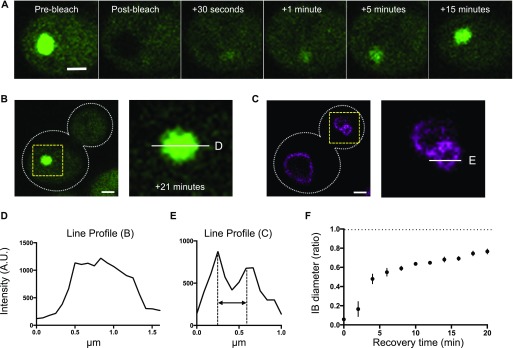
Figure 3. The mHtt within an IB is mobile.
(A) Recovery of mHtt(72Q)-GFP fluorescence within an IB following photobleaching. Single planes are shown from z-series taken at 200-nm intervals. Bar, 1 μm. In the pre-bleach image, the long axis of the IB is 1,100 nm, and the short axis is 900 nm; after 15 min of recovery, the long and short axes of the IB are 900 and 730 nm, respectively. Bar, 1 μm. (B, D) Left panel, single plane showing the same cell as in (A), at 21 min post-bleach. Right panel, enlarged view of area inside yellow box, with white line indicating the location of the profile plot in (D). Bar, 1 μm. (C) Left panel, single plane showing Vph1-mCherry in the same cell as in (A) and (B). Bar, 1 μm. (E) Right panel, enlarged view of area inside yellow box, with white line indicating the location of the profile plot in (E). (D) Intensity profile of the line across the center of the IB shown in (B). (E) The intensity profile of the line across the center of a small vacuole in the bud shown in (C). Double-headed arrow indicates the distance between the two sides of the vacuole (380 nm). (F) Ratio of IB diameter to pre-bleach IB diameter as a function of time of recovery (n = 6, error bars indicate SEM).

