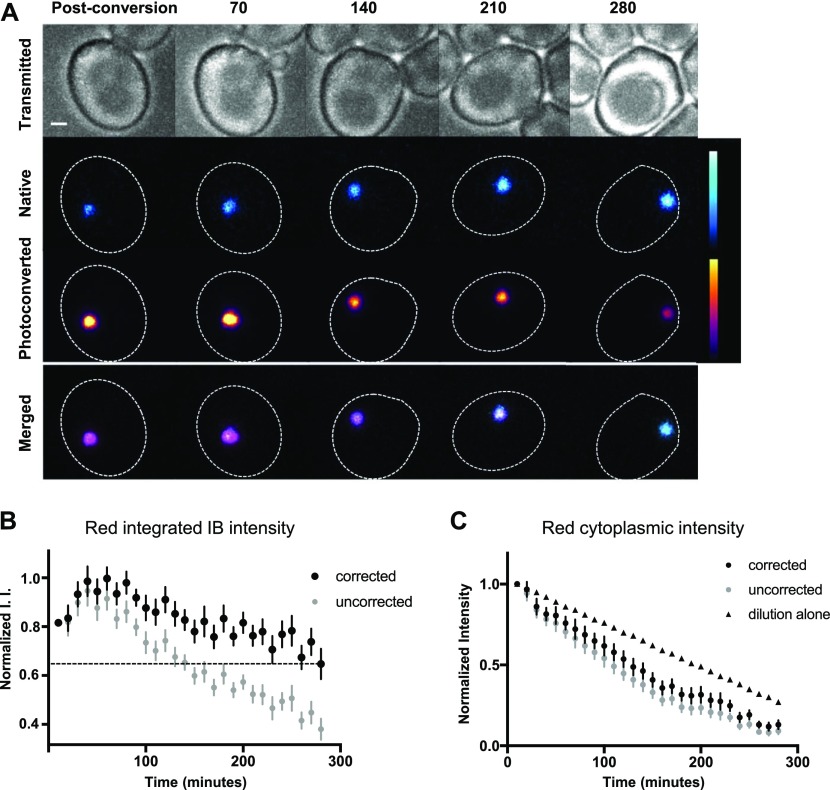
Figure 4. Mutant Htt in the IB is turned over.
(A) Time-lapse images of mHtt(72Q)-mEos2 were collected every 10 min following photoconversion of a portion of the mEos2 from green to red. Images of a cell containing a large IB taken immediately after photoconversion, and then every 70 min for 280 min, are shown in bright-field (upper panels), the native and photoconverted channels separately (middle two rows), and with native (cyan) and photoconverted (magenta) channels merged (lower panels). Numbers indicate minutes after photoconversion. To better display intensity changes, “fire” and “ice” lookup tables are used in the middle panels; intensity calibration bars are shown on the right. Bar, 1 μm. Mother cell body outlined in dashed white line. (B, C) Integrated red intensity (I.I.) of IBs (B) and mean red cytoplasmic intensity (C) after photoconversion for mHtt(72Q)-mEos2–expressing cells was measured over 4.5 h. Values before (grey circles) and after (black circles) correction for photobleaching were normalized and reported as the fraction of the maximum value following photoconversion. The predicted decrease in cytoplasmic intensity based on dilution of the cytoplasm due to cell growth and division is shown (triangles). Mean ± SEM is shown for 17 cells.

