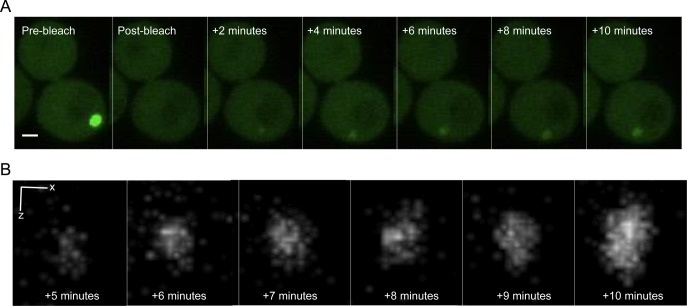
Figure S2. 3D rendering of Htt(72Q)-GFP entering the IB.
(A) Recovery of mHtt(72Q)-GFP fluorescence within an IB following photobleaching. Maximum-intensity projections of z-stacks taken at 100-nm intervals are shown. Bar, 1 μm. In the pre-bleach image, the long axis of the IB is 800 nm; after 10 min of recovery, the apparent diameter of the IB is 625 nm. The optical section for these images is calculated to be 300 nm, and the x–y resolution 180 nm. (B) 3D rendering of the z-stack of the IB shown in (A). X bar, 80 nm; Z bar, 100 nm.

