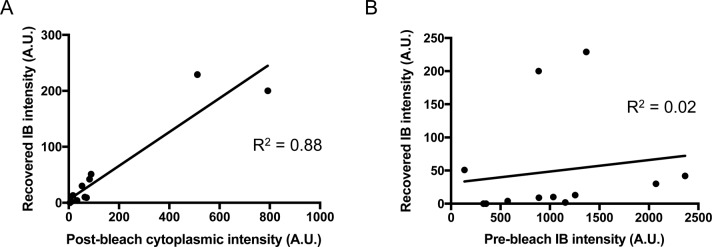
Figure S3. Recovered fluorescence is entering the IB from the cytoplasm.
(A, B) Total recovered IB fluorescence intensity varies linearly with the post-bleach cytoplasmic intensity (R2 = 0.88, n = 12 IBs), whereas (B) a plot of total recovered IB fluorescence intensity versus pre-bleach total IB fluorescence for the same IBs does not show a linear relationship (R2 = 0.02, n = 12).

