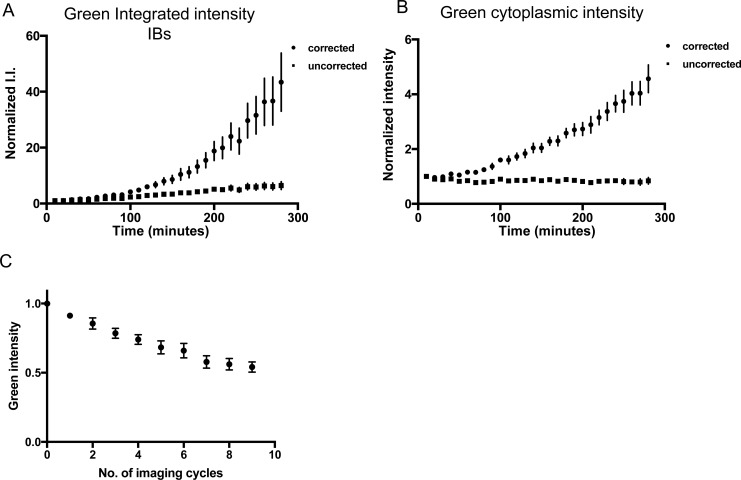
Figure S4. Green Htt is continuously synthesized and added to the IB and cytoplasm.
(A, B) Integrated green intensity (I.I.) of IBs in the green channel and (B) mean green cytoplasmic intensity of mHtt(72Q)-mEos2–expressing cells after photoconversion was measured over the 4.5-h time course. Values were normalized to the initial value immediately following photoconversion. The graph shows mean intensity value ± SEM for 17 cells with IBs. Intensity values corrected for photobleaching (circles) and uncorrected for photobleaching (squares) are shown. The correction for photobleaching assumes that all green mHtt(72Q)-mEos2 present in the cell were exposed to every imaging cycle that occurred during the 4.5-h time course, that is, that all green mHtt(72Q)-mEos2 molecules were present for the entire time course. Therefore, the intensity values corrected for photobleaching are maximum possible intensity values. (C) Normalized intensity values for cellular green mHtt(72Q)-mEos2 when imaged 10 times as rapidly as possible; error bars indicate SEM. After 10 rapid cycles of imaging, the green cytoplasmic intensity is 0.54 ± 0.04 A.U. If no new mHtt(72Q)-mEos2 was synthesized, bleaching due to 28 rounds of imaging would be expected to cause the average cytoplasmic intensity to drop to ∼3.5% of its original value at most, considering only fluorescence loss due to cell division. However, it drops only slightly, to 84% of the original value. From the uncorrected intensity values, it is clear that the green mHtt(72Q)-mEos2 present in the cell is a mixed population which contains a substantial amount of newly synthesized green mHtt(72Q)-mEos2. Therefore, the true value lies between the corrected and uncorrected values.

