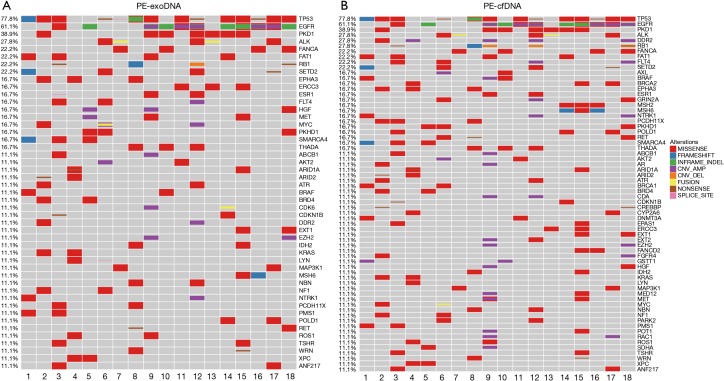
Figure 1.
The mutational profiles of PE-exoDNA or matched PE-cfDNA samples. (A) Mutations found in PE-exoDNA and (B) in PE-cfDNA from 18 patients with advanced lung adenocarcinoma. The two patients with only PE-exoDNA were excluded from the analysis. Mutations that occurred in at least two patients are shown. Names of mutated genes are shown on the right of the graphs. Each row shows mutated genes in a patient and each column (from No. 1 to 18) represents gene mutations in a patient. Gene alterations are color coded as indicated in the graphs. The specific frequencies (in percent) are indicated on the left. The number of mutations in each patient is shown on the top of each column and the number of mutations in a gene is shown on the right of the corresponding gene.

