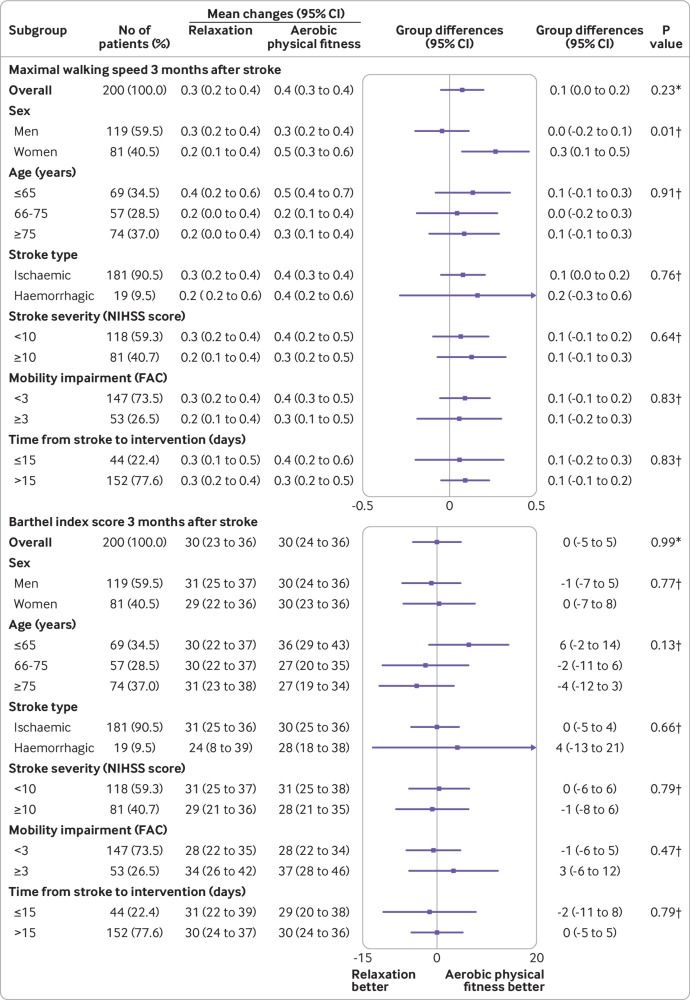
Fig 4.
Prespecified subgroup analyses. Forest plots display maximal walking speed and Barthel index scores. Results are based on multiple imputation. No data were available for time from stroke to intervention for four participants who were excluded at screening. National Institutes of Health Stroke scale (NIHSS) score was missing for one participant owing to missing hospital chart. FAC=functional ambulation category. *P value for primary outcome measure. †P values for age×group interaction

