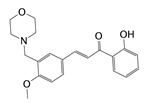
Table 3.
Hit compounds selected from Specs database.
| Hits | ID Number | Structure | RMSD [Å] a | Docking Score [kcal·mol−1] b |
|---|---|---|---|---|
| 1 | AG-690/11549747 |

|
0.5949 | −13.9247 |
| 2 | AH-487/40716190 |

|
0.6174 | −13.3812 |
| 3 | AQ-090/41836624 |

|
0.6168 | −13.2506 |
| 4 | AN-829/40763420 |

|
0.5961 | −13.7928 |
| 5 | AN-829/40458057 |

|
0.5974 | −13.4773 |
a The root of the mean square distance between the query features and their matching ligand annotation points (lower RMSD values indicate better mapping of query features and the ligand annotation points); b Binding free energy between tubulin and a ligand (lower values indicate better binding affinity).
