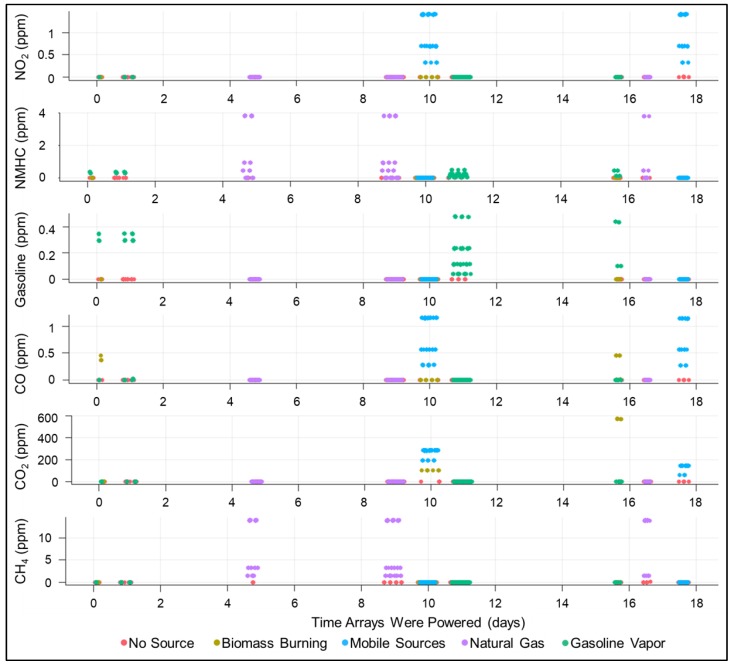
Figure 3.
Timeseries of reference concentrations for each “key” component gas, colored by the simulated pollutant source. X-axis indicates elapsed time in days that the sensor arrays were powered. Gaps in the plots indicate times that they were powered but no test was being performed. During these times, the arrays were left in the chamber at room temperature and exposed to ambient indoor air.

