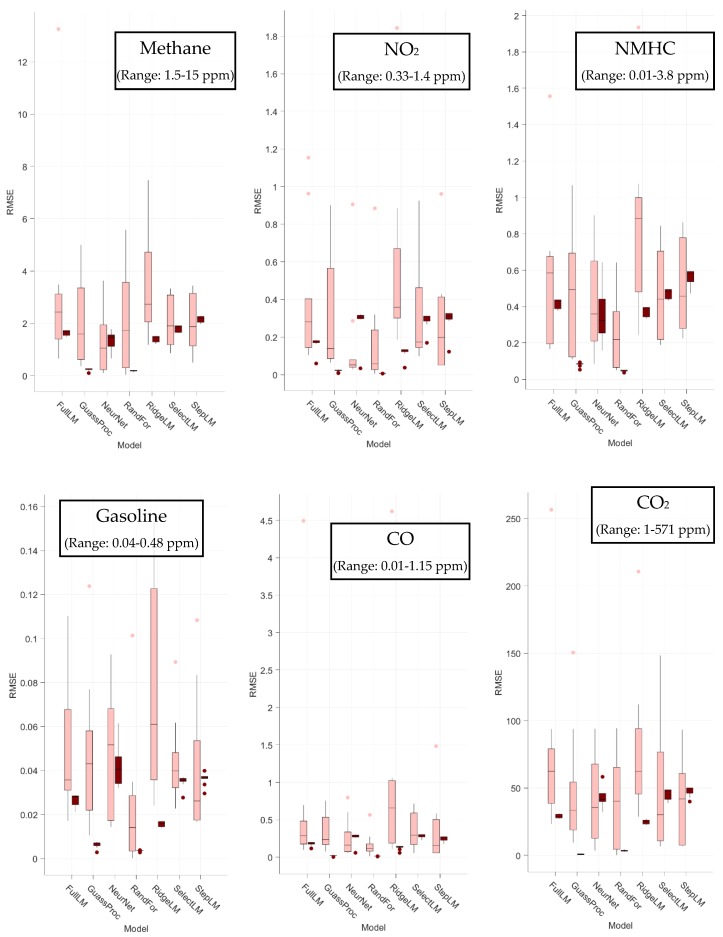
Figure 5.
Boxplots of root mean squared error (RMSE) values (ppm) from each fold using each model and species. Bars indicate the 25th and 75th percentile values, whiskers extend to values within 1.5 times that range from the median, and dots represent points outside of that range as calculated using the GRAMM package implemented in MATLAB [61].

