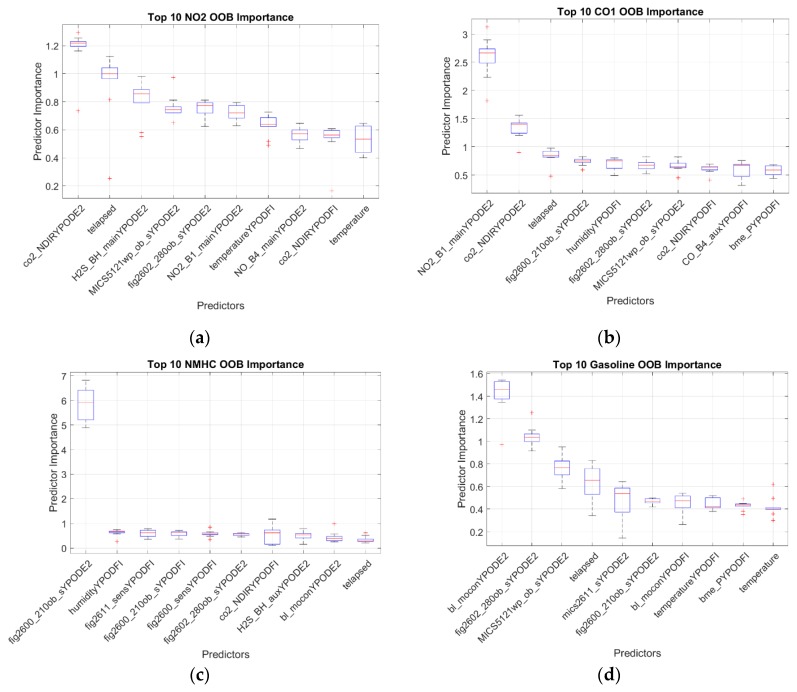
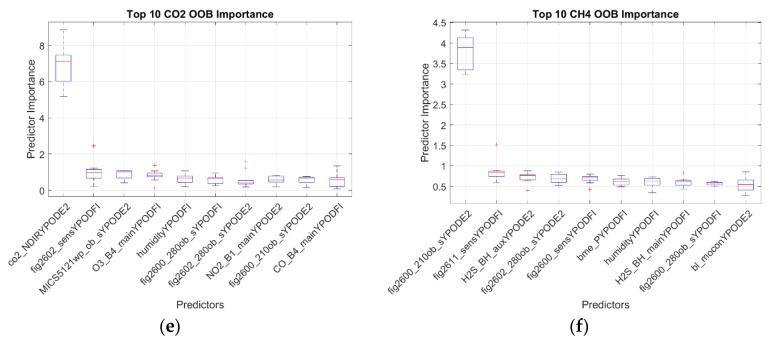
Figure 10.
Box plots of the top 10 predictors sorted by out-of-bag importance estimates for each regressed pollutant. These pollutants were (a) NO2, (b) CO, (c) NMHC, (d) Gasoline, (e) CO2, and (f) CH4. Boxes indicate the variation in the predictor importance when models were trained on different cross-validation folds.


