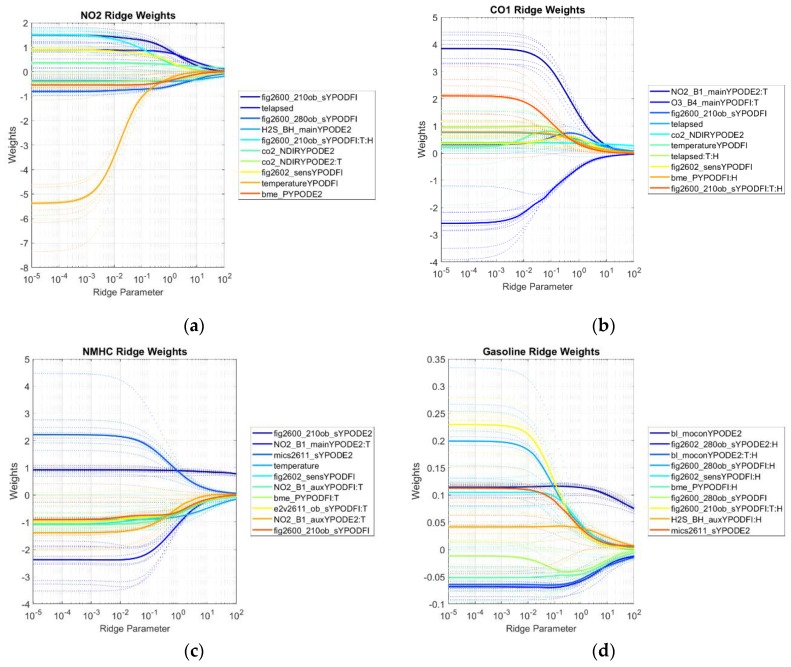
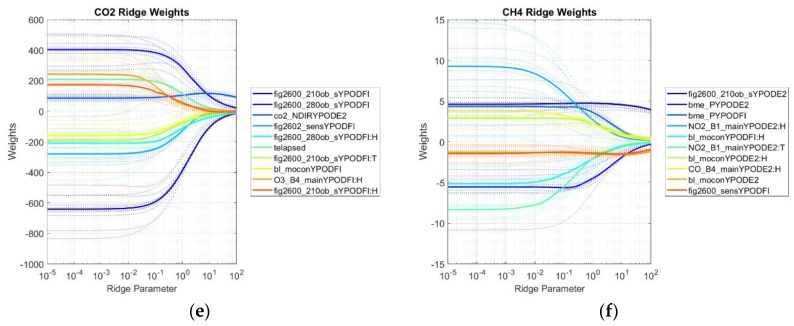
Figure 11.
Summary of ridge traces of the top 10 most important parameters from the regression of each pollutant. These pollutants were (a) NO2, (b) CO, (c) NMHC, (d) Gasoline, (e) CO2, and (f) CH4. Weight magnitude should not be compared between compounds because they scale with the concentration values. Interactions with temperature and/or humidity are indicated by “:T”, “:H”, or “:T:H, respectively. Colors indicate the sensor and are sorted from largest to smallest importance at high regularization. Dashed lines illustrate the ridge trace for each cross-validation fold, and the solid lines illustrate the median value for all folds. The x-axis of each plot indicates the ridge parameter (regularization strength), and the y-axis indicates the unbiased parameter weight. Larger absolute values indicate a stronger importance of that sensor, especially at larger values of the ridge parameter.


